
- Home >
- Stock Photos >
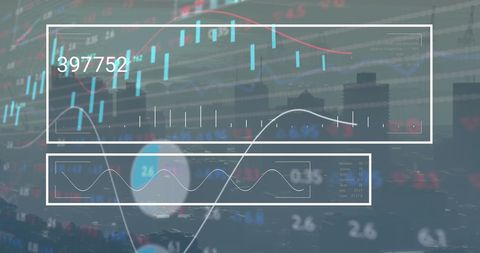
- Stock Market Data on Digital Interface with Candlestick Chart
Stock Market Data on Digital Interface with Candlestick Chart Image

Illustration shows stock market data with a focus on digital analytics and a candlestick trading chart. Suitable for websites and articles related to finance, trading platforms, economic analysis, and data-driven decision-making.
Powered by 


downloads
Tags:
More
Credit Photo
If you would like to credit the Photo, here are some ways you can do so
Text Link
photo Link
<span class="text-link">
<span>
<a target="_blank" href=https://pikwizard.com/photo/stock-market-data-on-digital-interface-with-candlestick-chart/efccca4e5cf3d3022c41999f84f4b12a/>PikWizard</a>
</span>
</span>
<span class="image-link">
<span
style="margin: 0 0 20px 0; display: inline-block; vertical-align: middle; width: 100%;"
>
<a
target="_blank"
href="https://pikwizard.com/photo/stock-market-data-on-digital-interface-with-candlestick-chart/efccca4e5cf3d3022c41999f84f4b12a/"
style="text-decoration: none; font-size: 10px; margin: 0;"
>
<img src="https://pikwizard.com/pw/medium/efccca4e5cf3d3022c41999f84f4b12a.jpg" style="margin: 0; width: 100%;" alt="" />
<p style="font-size: 12px; margin: 0;">PikWizard</p>
</a>
</span>
</span>
Free (free of charge)
Free for personal and commercial use.
Author: Creative Art
Similar Free Stock Images

Premium


Premium


Premium


Premium

Premium


Premium


Premium

Premium


Premium


Premium

Premium


Premium

Premium

Premium


Premium


Premium


Premium


Premium


Premium

Premium

Premium


Premium


Premium


Premium

Premium


Explore More Free Stock Images