- Home >
- Stock Photos >
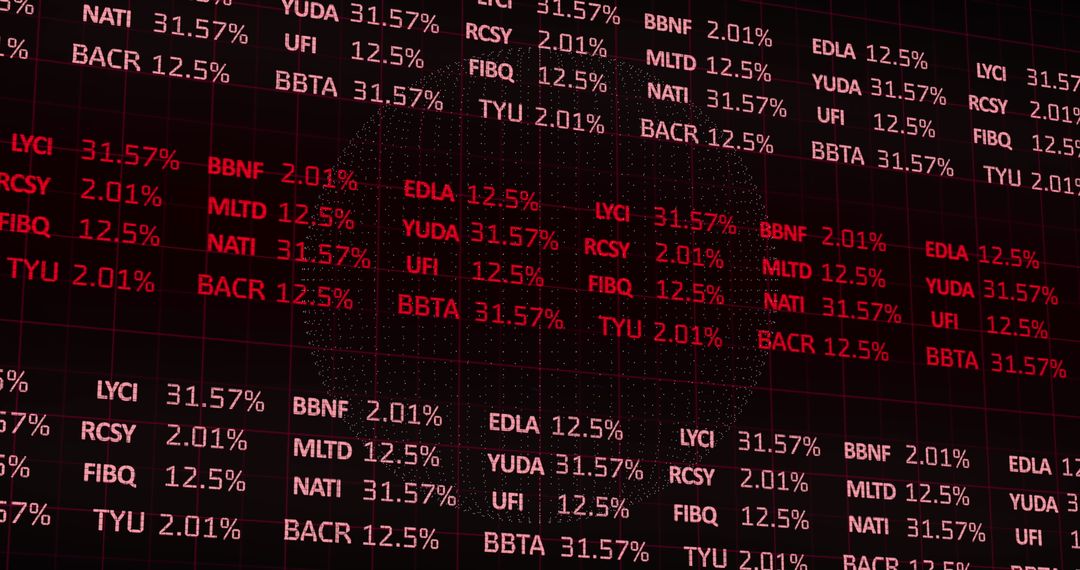
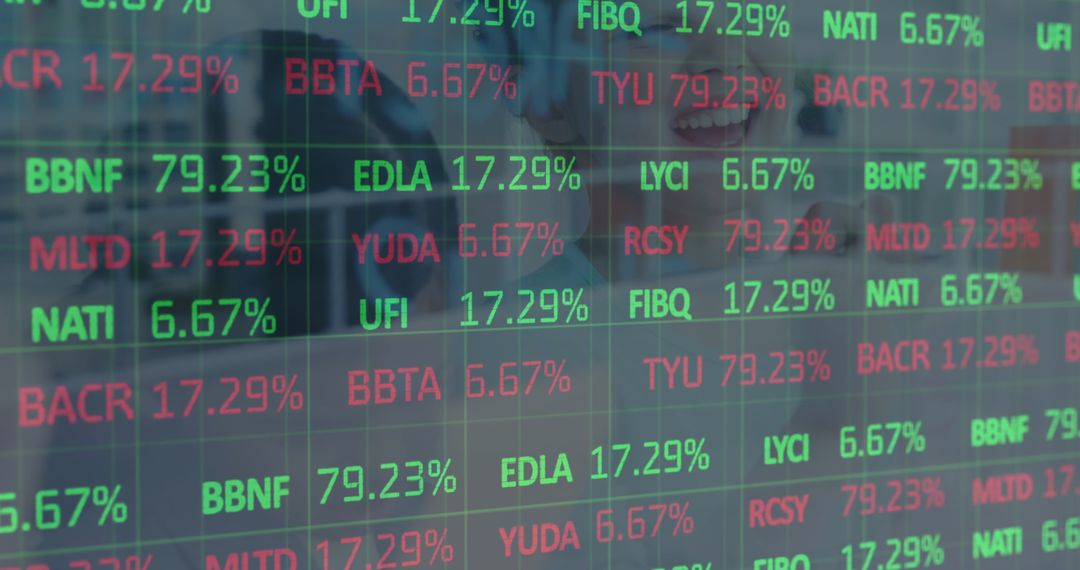
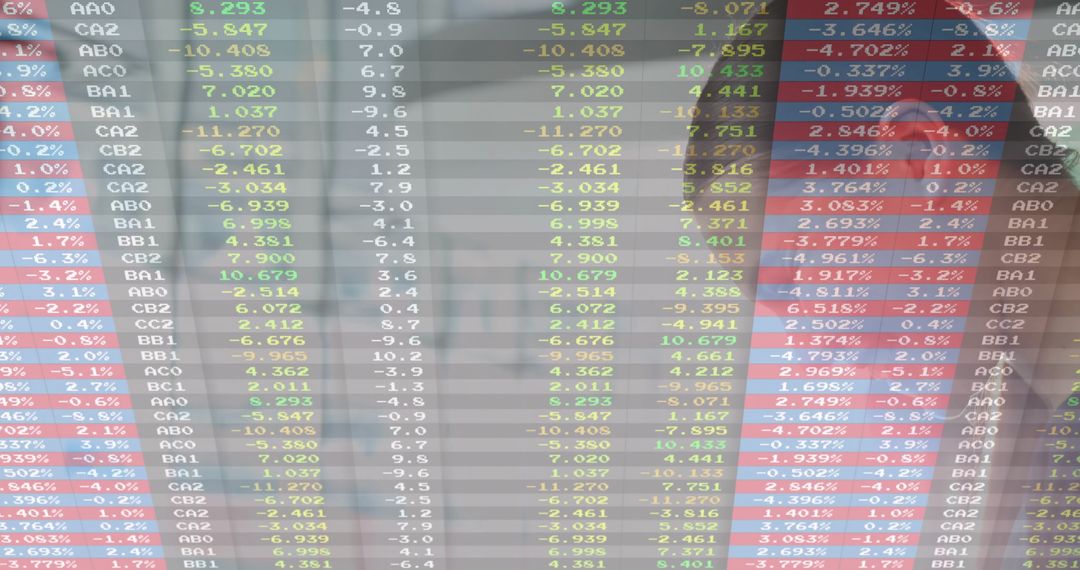
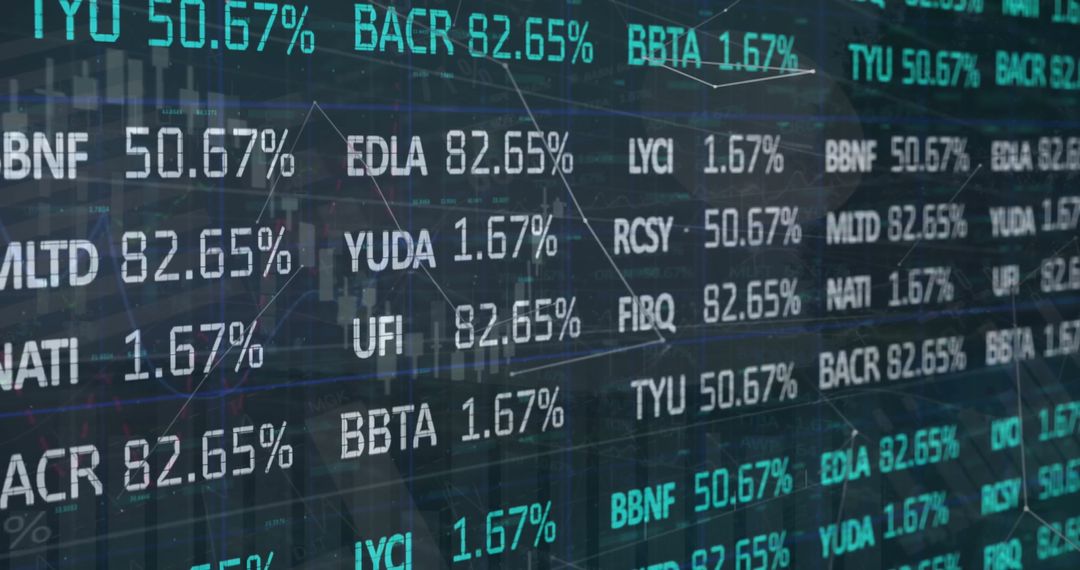
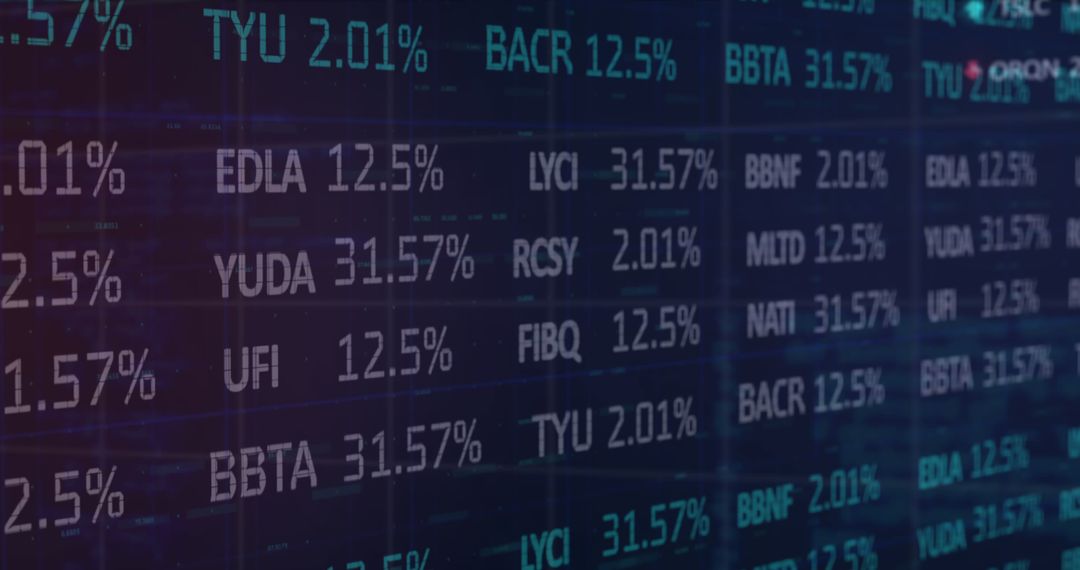
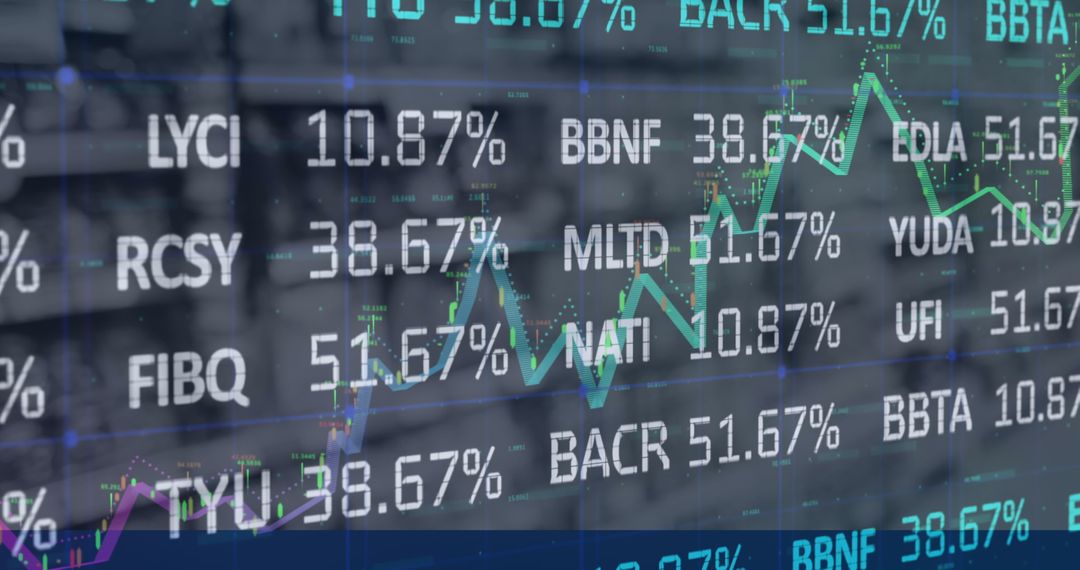
- Stock Market Data Visualization on Overlay Screen
Stock Market Data Visualization on Overlay Screen Image
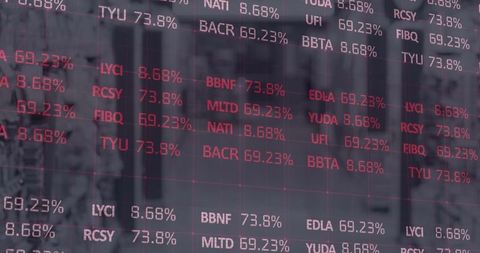
Image showcases stock market data presented with percentage values on an overlay screen, symbolizing financial analytics and business intelligence. Useful for illustrating concepts related to investment analysis, finance news, or business strategy reports. Highlights the role of modern technology in understanding global markets.
Powered by 


2
downloads
downloads
Tags:
More
Credit Photo
If you would like to credit the Photo, here are some ways you can do so
Text Link
photo Link
<span class="text-link">
<span>
<a target="_blank" href=https://pikwizard.com/photo/stock-market-data-visualization-on-overlay-screen/3b9df62f1b0a516110014178b42b6ffb/>PikWizard</a>
</span>
</span>
<span class="image-link">
<span
style="margin: 0 0 20px 0; display: inline-block; vertical-align: middle; width: 100%;"
>
<a
target="_blank"
href="https://pikwizard.com/photo/stock-market-data-visualization-on-overlay-screen/3b9df62f1b0a516110014178b42b6ffb/"
style="text-decoration: none; font-size: 10px; margin: 0;"
>
<img src="https://pikwizard.com/pw/medium/3b9df62f1b0a516110014178b42b6ffb.jpg" style="margin: 0; width: 100%;" alt="" />
<p style="font-size: 12px; margin: 0;">PikWizard</p>
</a>
</span>
</span>
Free (free of charge)
Free for personal and commercial use.
Author: Creative Art
Similar Free Stock Images

Premium


Premium


Premium


Premium


Premium


Premium


Premium


Premium


Premium


Premium


Premium


Premium


Premium


Premium


Premium


Premium


Premium


Premium


Premium


Premium


Premium


Premium


Premium


Premium