- Home >
- Stock Photos >
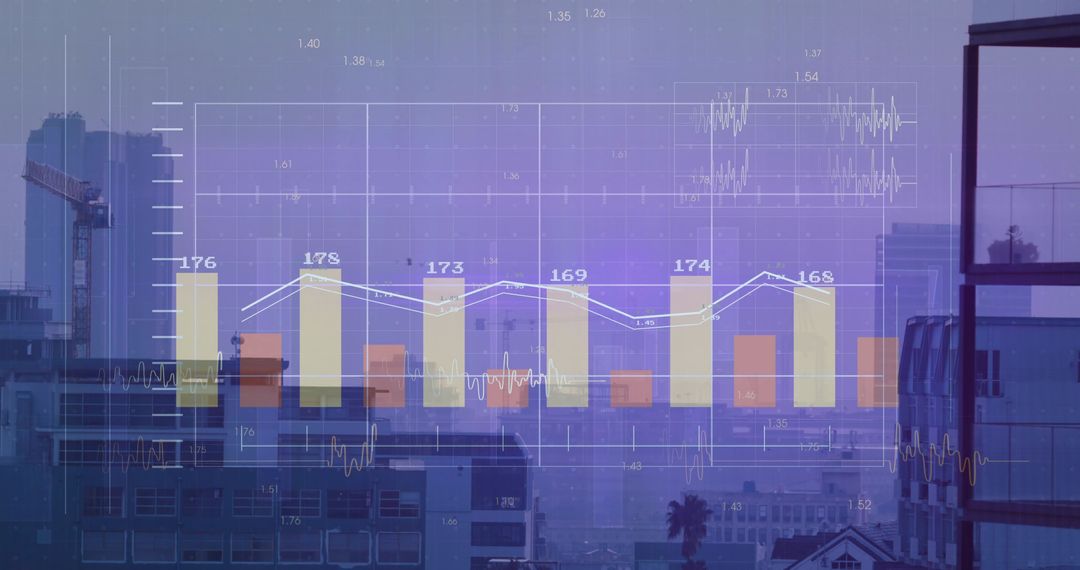
- Stock Market Data Visualization With Bar and Line Graphs
Stock Market Data Visualization With Bar and Line Graphs Image

Displays a concept of data visualization representing stock market analytics, including yellow bar graphs and a white line graph on a purple backdrop. Stock tickers enhance visual representation of a dynamic and engaging financial display. Useful for depicting financial services, technology in finance, data trends, or digital investment strategies in presentations, publications, or educational materials.
Powered by 


0
downloads
downloads
Tags:
More
Credit Photo
If you would like to credit the Photo, here are some ways you can do so
Text Link
photo Link
<span class="text-link">
<span>
<a target="_blank" href=https://pikwizard.com/photo/stock-market-data-visualization-with-bar-and-line-graphs/4c9e527b42b83de14c70b3410bc181e0/>PikWizard</a>
</span>
</span>
<span class="image-link">
<span
style="margin: 0 0 20px 0; display: inline-block; vertical-align: middle; width: 100%;"
>
<a
target="_blank"
href="https://pikwizard.com/photo/stock-market-data-visualization-with-bar-and-line-graphs/4c9e527b42b83de14c70b3410bc181e0/"
style="text-decoration: none; font-size: 10px; margin: 0;"
>
<img src="https://pikwizard.com/pw/medium/4c9e527b42b83de14c70b3410bc181e0.jpg" style="margin: 0; width: 100%;" alt="" />
<p style="font-size: 12px; margin: 0;">PikWizard</p>
</a>
</span>
</span>
Free (free of charge)
Free for personal and commercial use.
Author: Authentic Images
Similar Free Stock Images

Premium


Premium


Premium


Premium


Premium


Premium


Premium


Premium


Premium


Premium


Premium


Premium


Premium


Premium


Premium


Premium


Premium


Premium


Premium


Premium


Premium


Premium


Premium


Premium