- Home >
- Stock Photos >
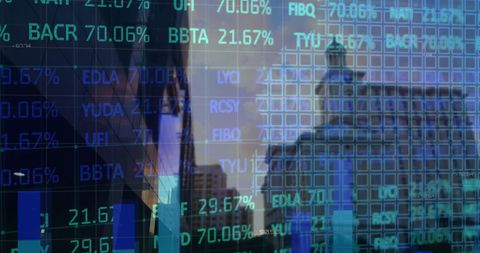
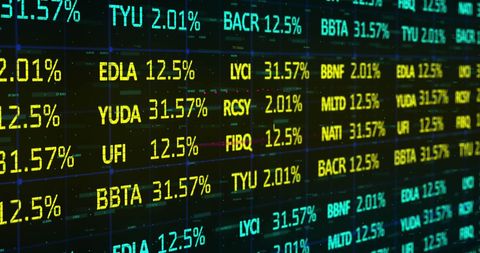
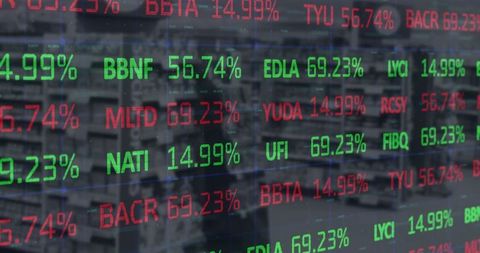
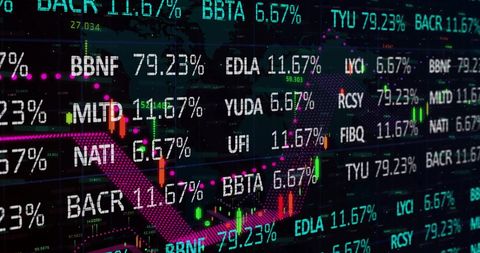
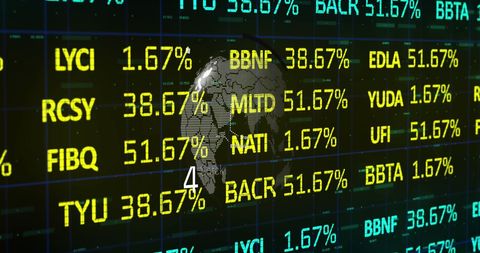
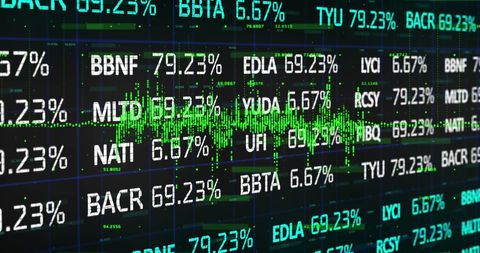
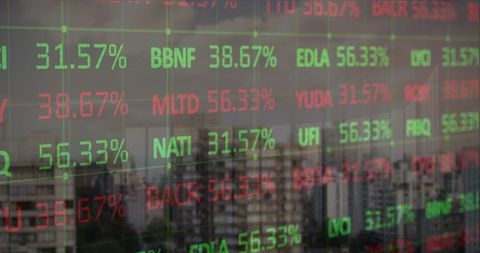
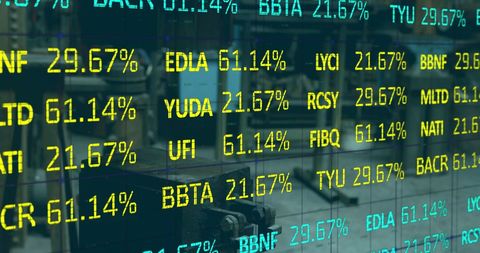
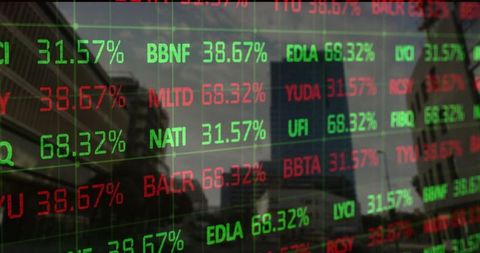
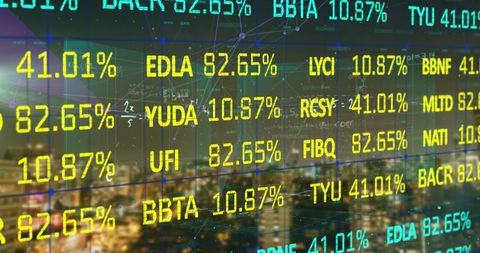
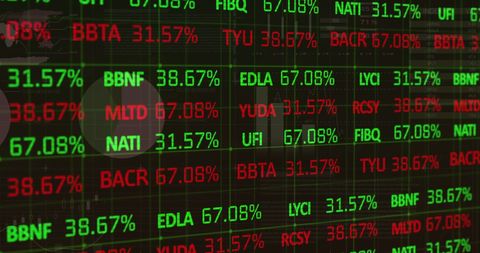
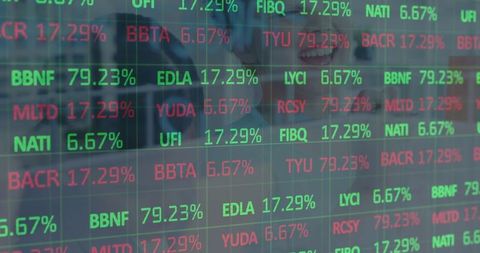
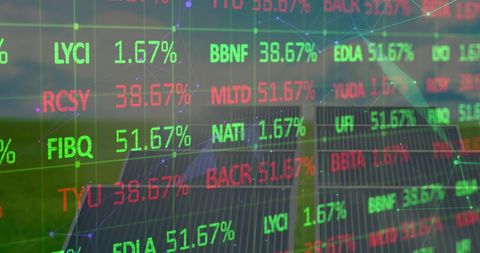
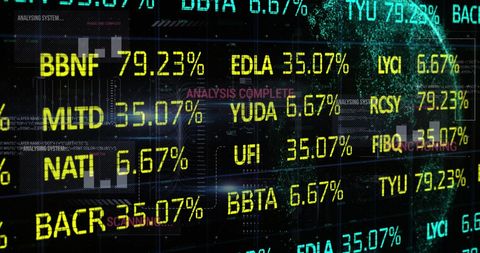
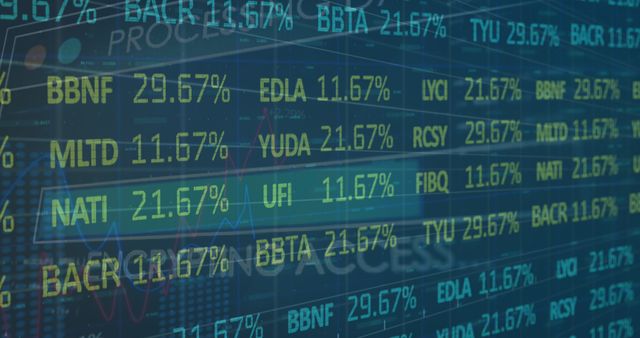
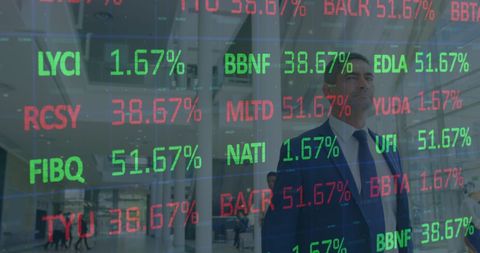
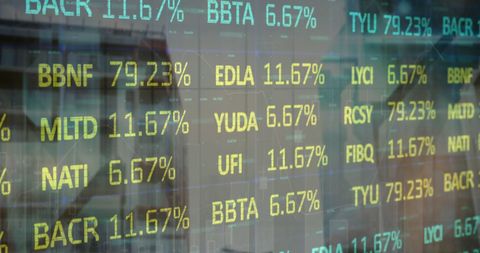
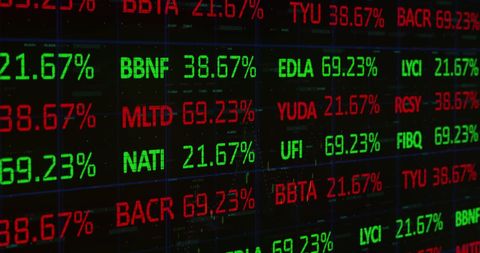
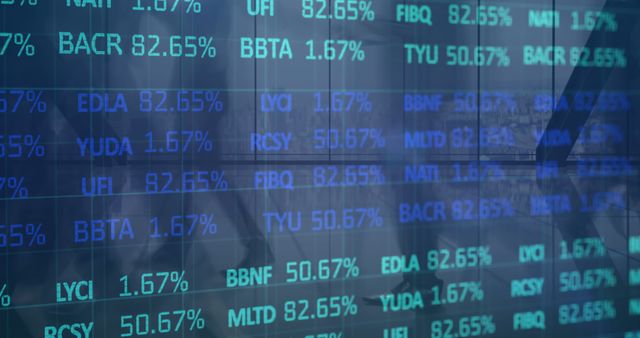
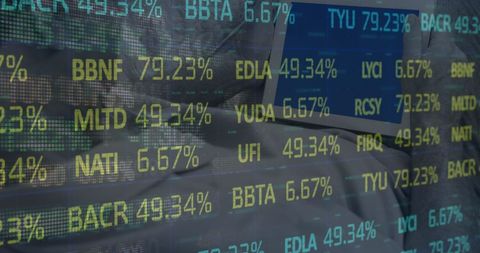
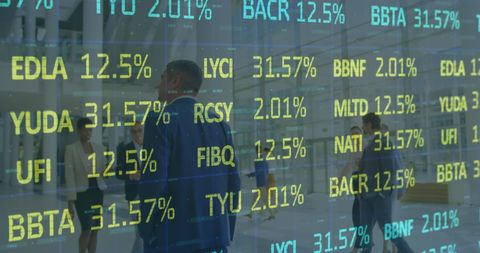
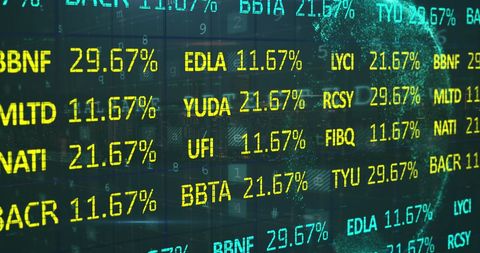
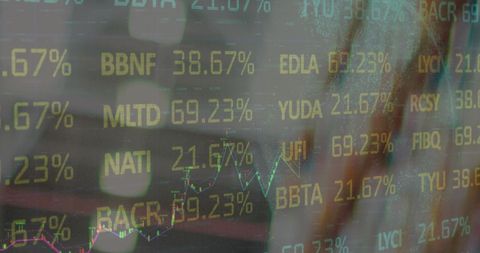
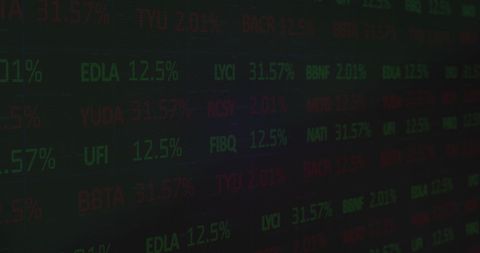
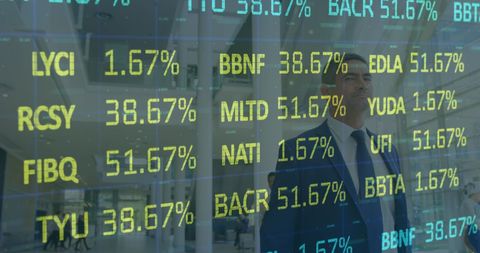
- Stock Market Data Visualization with Computing Technology
Stock Market Data Visualization with Computing Technology Image
Displays interconnected digital data processing in the stock market world. Useful for illustrating concepts in finance, business analytics, and digital economics. Suitable for educational materials, financial reports, and tech-centered presentations seeking to provide a glimpse into data interaction and finance evolution.

downloads
Tags:
More
Credit Photo
If you would like to credit the Photo, here are some ways you can do so
Text Link
photo Link
<span class="text-link">
<span>
<a target="_blank" href=https://pikwizard.com/photo/stock-market-data-visualization-with-computing-technology/7dbff28529271308a3ad2e9a823f732f/>PikWizard</a>
</span>
</span>
<span class="image-link">
<span
style="margin: 0 0 20px 0; display: inline-block; vertical-align: middle; width: 100%;"
>
<a
target="_blank"
href="https://pikwizard.com/photo/stock-market-data-visualization-with-computing-technology/7dbff28529271308a3ad2e9a823f732f/"
style="text-decoration: none; font-size: 10px; margin: 0;"
>
<img src="https://pikwizard.com/pw/medium/7dbff28529271308a3ad2e9a823f732f.jpg" style="margin: 0; width: 100%;" alt="" />
<p style="font-size: 12px; margin: 0;">PikWizard</p>
</a>
</span>
</span>
Free (free of charge)
Free for personal and commercial use.
Author: Awesome Content