
- Home >
- Stock Photos >
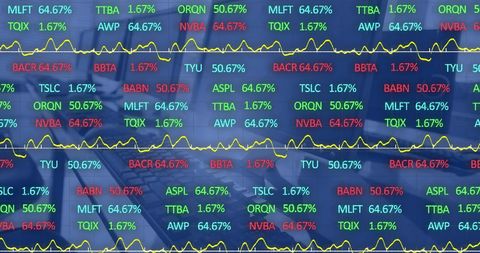
- Stock Market Data Visualization with Digital Interface Concept
Stock Market Data Visualization with Digital Interface Concept Image

Digital data overlaying stock market numbers illustrates concepts of global technology, online security, and financial trends. Suitable for presentations on global finance, investment strategies, and technological advancements in stock trading. Great as a background visual for financial reports or educational materials on economic analysis.
Powered by 


downloads
Tags:
More
Credit Photo
If you would like to credit the Photo, here are some ways you can do so
Text Link
photo Link
<span class="text-link">
<span>
<a target="_blank" href=https://pikwizard.com/photo/stock-market-data-visualization-with-digital-interface-concept/390ac6d5148c22c8a5506679a073714b/>PikWizard</a>
</span>
</span>
<span class="image-link">
<span
style="margin: 0 0 20px 0; display: inline-block; vertical-align: middle; width: 100%;"
>
<a
target="_blank"
href="https://pikwizard.com/photo/stock-market-data-visualization-with-digital-interface-concept/390ac6d5148c22c8a5506679a073714b/"
style="text-decoration: none; font-size: 10px; margin: 0;"
>
<img src="https://pikwizard.com/pw/medium/390ac6d5148c22c8a5506679a073714b.jpg" style="margin: 0; width: 100%;" alt="" />
<p style="font-size: 12px; margin: 0;">PikWizard</p>
</a>
</span>
</span>
Free (free of charge)
Free for personal and commercial use.
Author: Creative Art
Similar Free Stock Images

Premium


Premium

Premium


Premium


Premium


Premium


Premium


Premium


Premium

Premium

Premium


Premium


Premium


Premium


Premium


Premium

Premium


Premium


Premium


Premium

Premium

Premium


Premium


Premium


Premium


Explore More Free Stock Images