
- Home >
- Stock Photos >
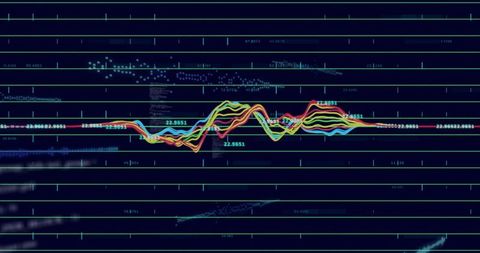
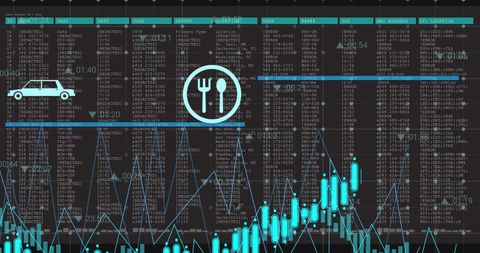
- Stock Market Data Visualization with Digital Interface
Stock Market Data Visualization with Digital Interface Image

Image features digital screens displaying stock market data and graphs, suggesting tech-savvy financial analytics theme. Suitable for finance-related blogs, fintech presentations, and articles about global market trends.
Powered by 


downloads
Tags:
More
Credit Photo
If you would like to credit the Photo, here are some ways you can do so
Text Link
photo Link
<span class="text-link">
<span>
<a target="_blank" href=https://pikwizard.com/photo/stock-market-data-visualization-with-digital-interface/0f187ce4b01f12facbdbe3af56db5695/>PikWizard</a>
</span>
</span>
<span class="image-link">
<span
style="margin: 0 0 20px 0; display: inline-block; vertical-align: middle; width: 100%;"
>
<a
target="_blank"
href="https://pikwizard.com/photo/stock-market-data-visualization-with-digital-interface/0f187ce4b01f12facbdbe3af56db5695/"
style="text-decoration: none; font-size: 10px; margin: 0;"
>
<img src="https://pikwizard.com/pw/medium/0f187ce4b01f12facbdbe3af56db5695.jpg" style="margin: 0; width: 100%;" alt="" />
<p style="font-size: 12px; margin: 0;">PikWizard</p>
</a>
</span>
</span>
Free (free of charge)
Free for personal and commercial use.
Author: Awesome Content
Similar Free Stock Images
Premium


Premium


Premium


Premium


Premium


Premium


Premium


Premium


Premium


Premium


Premium

Premium

Premium


Premium

Premium


Premium


Premium


Premium


Premium


Premium


Premium

Premium


Premium

Premium

Premium


Explore More Free Stock Images