
- Home >
- Stock Photos >
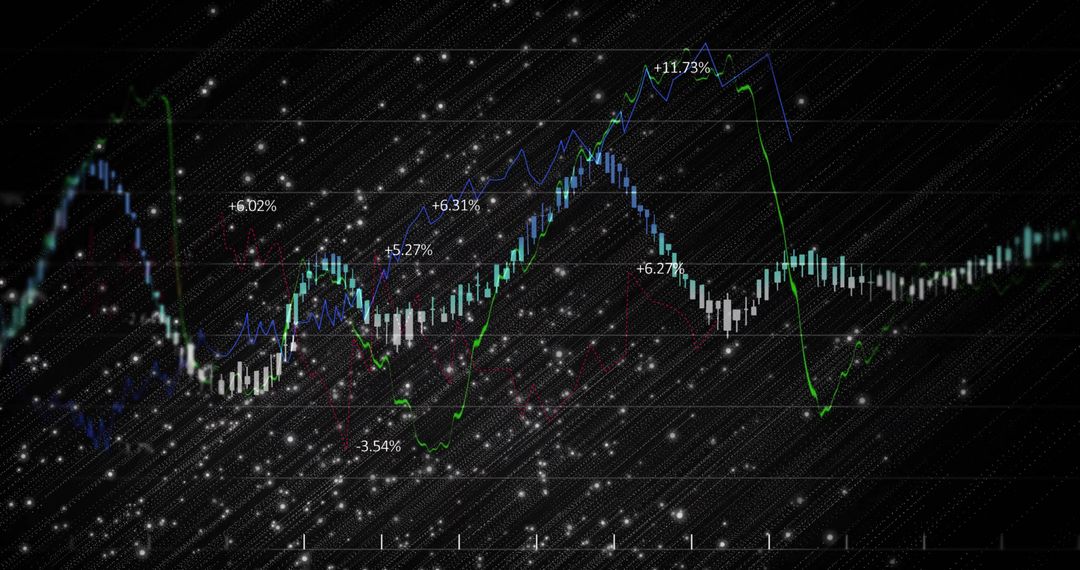
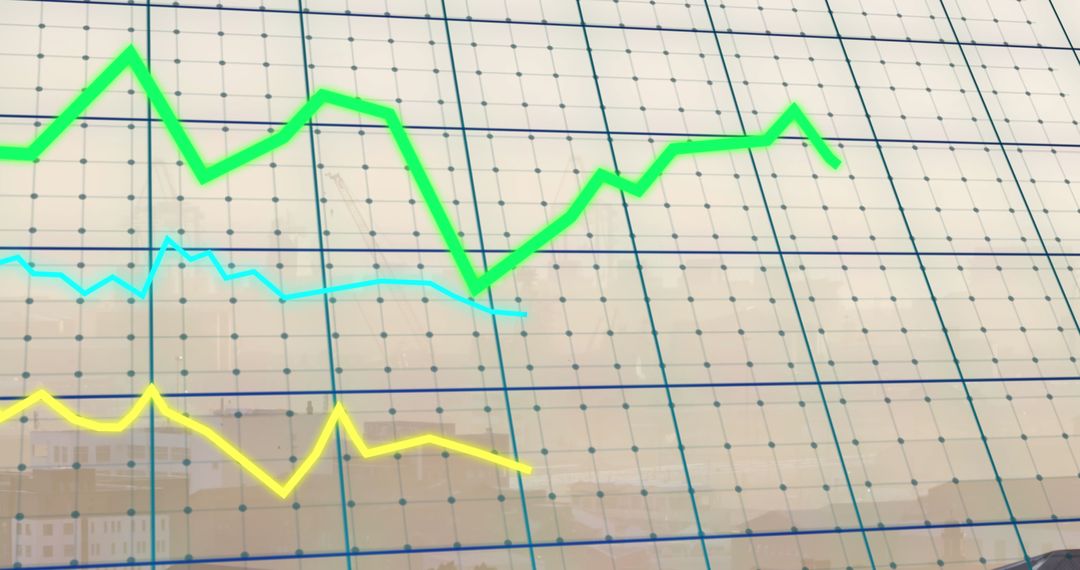
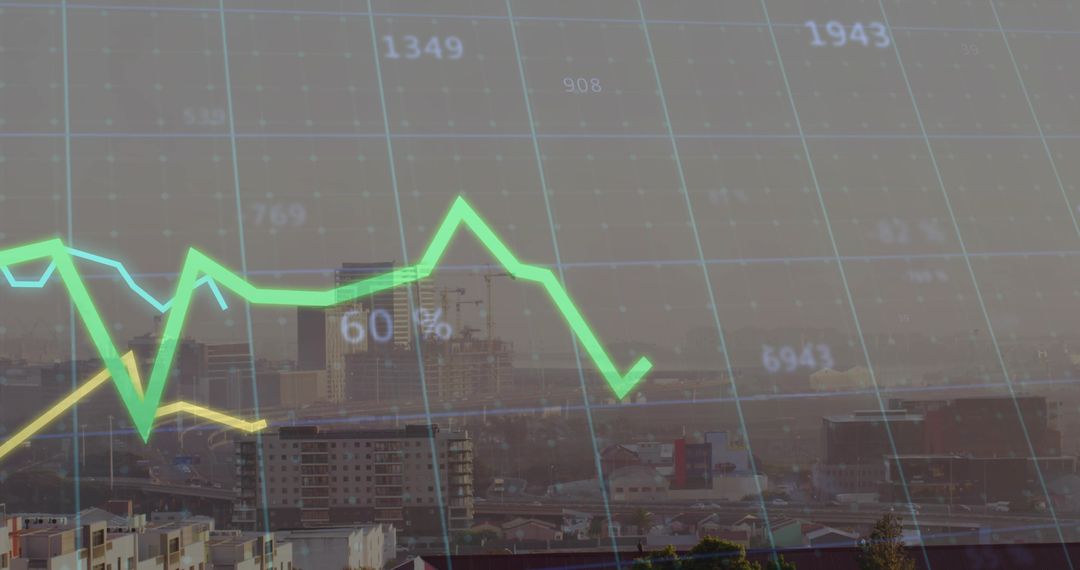
- Stock Market Data Visualization with Dynamic Graph Line Tracing
Stock Market Data Visualization with Dynamic Graph Line Tracing Image

Neon graphs with statistical data on a trading screen offer insights into financial markets and trends. Ideal for articles on stock market analysis, investment technology, finance reports, and future trends in trading analytics.
Powered by 


0
downloads
downloads
Tags:
More
Credit Photo
If you would like to credit the Photo, here are some ways you can do so
Text Link
photo Link
<span class="text-link">
<span>
<a target="_blank" href=https://pikwizard.com/photo/stock-market-data-visualization-with-dynamic-graph-line-tracing/104ced7e25b091e297444ac0a43dd3ab/>PikWizard</a>
</span>
</span>
<span class="image-link">
<span
style="margin: 0 0 20px 0; display: inline-block; vertical-align: middle; width: 100%;"
>
<a
target="_blank"
href="https://pikwizard.com/photo/stock-market-data-visualization-with-dynamic-graph-line-tracing/104ced7e25b091e297444ac0a43dd3ab/"
style="text-decoration: none; font-size: 10px; margin: 0;"
>
<img src="https://pikwizard.com/pw/medium/104ced7e25b091e297444ac0a43dd3ab.jpg" style="margin: 0; width: 100%;" alt="" />
<p style="font-size: 12px; margin: 0;">PikWizard</p>
</a>
</span>
</span>
Free (free of charge)
Free for personal and commercial use.
Author: People Creations
Similar Free Stock Images

Premium


Premium


Premium


Premium


Premium


Premium


Premium


Premium


Premium


Premium


Premium


Premium


Premium


Premium


Premium


Premium


Premium


Premium


Premium


Premium


Premium


Premium


Premium


Premium

