- Home >
- Stock Photos >
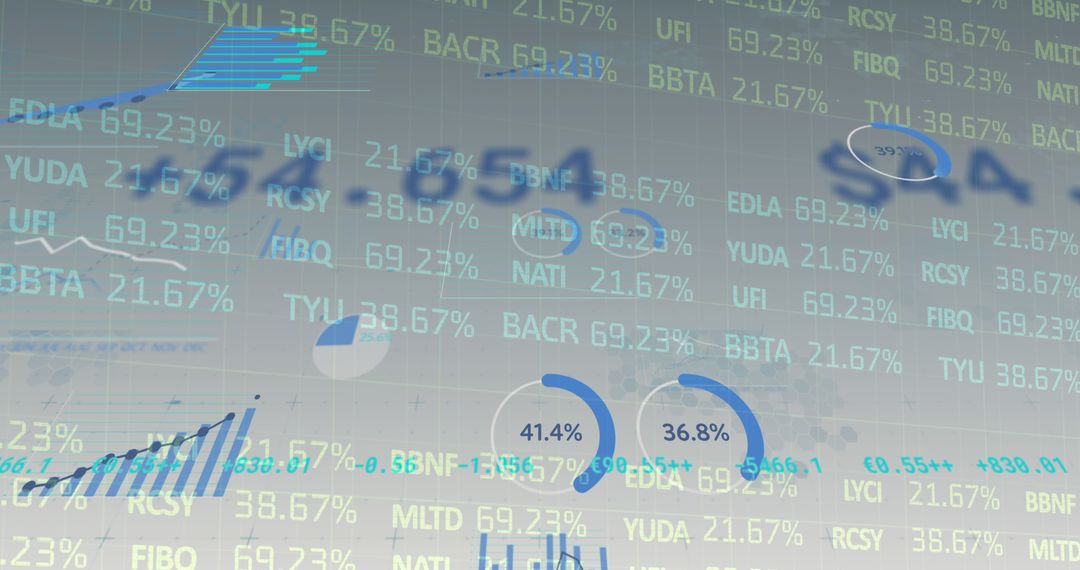
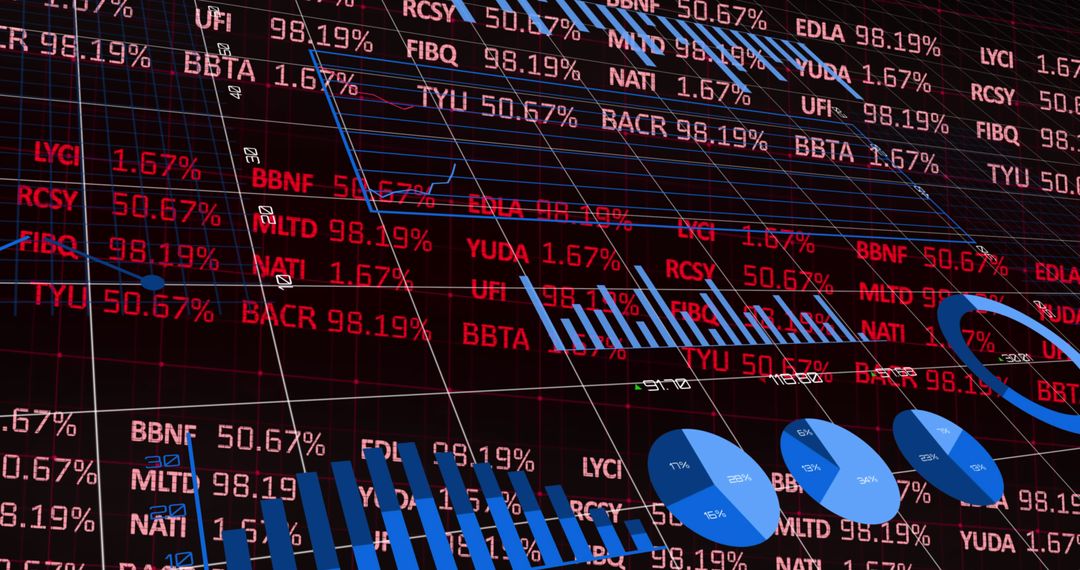
- Stock Market Data with Changing Global Financial Indicators
Stock Market Data with Changing Global Financial Indicators Image

Abstract representation of stock market data and financial analysis with a global theme. Bright numbers, world map cutouts, and tech elements create a dynamic background. Ideal for use in presentations or articles focusing on global economy, business finance solutions, trends in digital financial technologies, or economic forecasting.
Powered by 


2
downloads
downloads
Tags:
More
Credit Photo
If you would like to credit the Photo, here are some ways you can do so
Text Link
photo Link
<span class="text-link">
<span>
<a target="_blank" href=https://pikwizard.com/photo/stock-market-data-with-changing-global-financial-indicators/863adcbd1b099518a26d5ca35326dc01/>PikWizard</a>
</span>
</span>
<span class="image-link">
<span
style="margin: 0 0 20px 0; display: inline-block; vertical-align: middle; width: 100%;"
>
<a
target="_blank"
href="https://pikwizard.com/photo/stock-market-data-with-changing-global-financial-indicators/863adcbd1b099518a26d5ca35326dc01/"
style="text-decoration: none; font-size: 10px; margin: 0;"
>
<img src="https://pikwizard.com/pw/medium/863adcbd1b099518a26d5ca35326dc01.jpg" style="margin: 0; width: 100%;" alt="" />
<p style="font-size: 12px; margin: 0;">PikWizard</p>
</a>
</span>
</span>
Free (free of charge)
Free for personal and commercial use.
Author: Awesome Content
Similar Free Stock Images
Premium


Premium


Premium


Premium


Premium


Premium


Premium


Premium


Premium


Premium


Premium


Premium


Premium


Premium


Premium


Premium


Premium


Premium


Premium


Premium


Premium


Premium


Premium


Premium