- Home >
- Stock Photos >
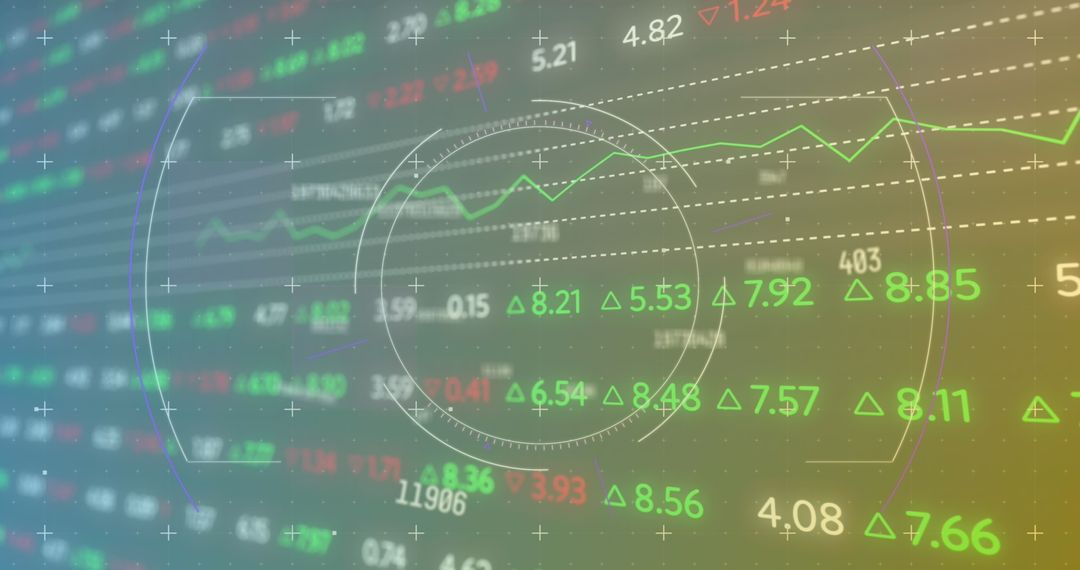
- Stock Market Data with Digital Financial Graphs
Stock Market Data with Digital Financial Graphs Image

Digital charts display stock market trends against a soft green background, illustrating various data crucial for investment analysis. Useful for financial, business, and technology themes, ideal for websites or presentations focused on trading, economic forecasting, or investment strategies.
Powered by 


2
downloads
downloads
Tags:
More
Credit Photo
If you would like to credit the Photo, here are some ways you can do so
Text Link
photo Link
<span class="text-link">
<span>
<a target="_blank" href=https://pikwizard.com/photo/stock-market-data-with-digital-financial-graphs/cd53ee60b725d071324f0c6d4adf0c54/>PikWizard</a>
</span>
</span>
<span class="image-link">
<span
style="margin: 0 0 20px 0; display: inline-block; vertical-align: middle; width: 100%;"
>
<a
target="_blank"
href="https://pikwizard.com/photo/stock-market-data-with-digital-financial-graphs/cd53ee60b725d071324f0c6d4adf0c54/"
style="text-decoration: none; font-size: 10px; margin: 0;"
>
<img src="https://pikwizard.com/pw/medium/cd53ee60b725d071324f0c6d4adf0c54.jpg" style="margin: 0; width: 100%;" alt="" />
<p style="font-size: 12px; margin: 0;">PikWizard</p>
</a>
</span>
</span>
Free (free of charge)
Free for personal and commercial use.
Author: Authentic Images
Similar Free Stock Images

Premium


Premium


Premium


Premium


Premium


Premium


Premium


Premium


Premium


Premium


Premium


Premium


Premium


Premium


Premium


Premium


Premium


Premium


Premium


Premium


Premium


Premium


Premium


Premium


Premium