- Home >
- Stock Photos >
- Stock Market Data with Graphs and Diagrams in Gray Tones
Stock Market Data with Graphs and Diagrams in Gray Tones Image

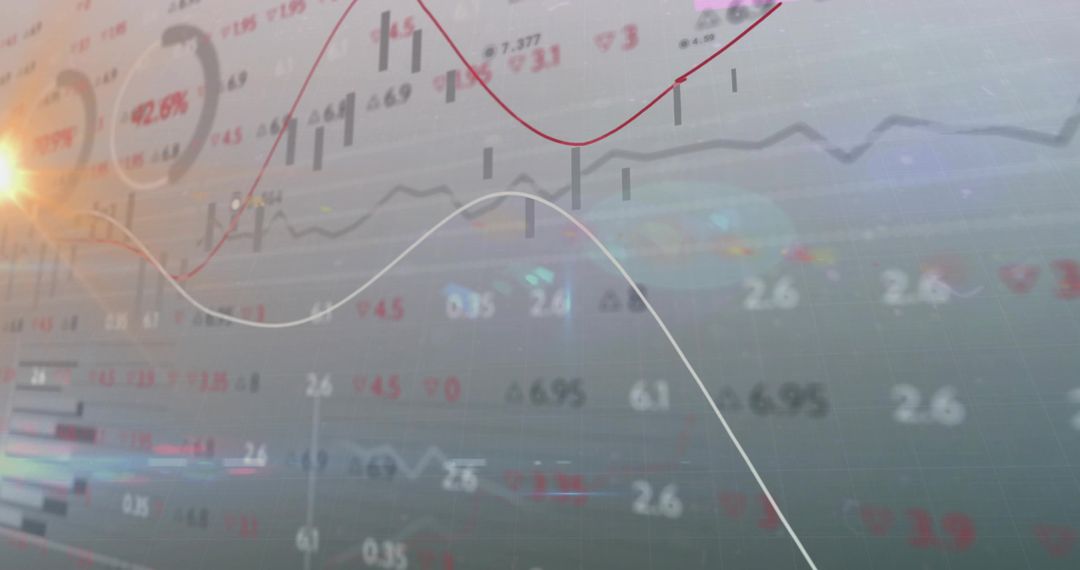
This depiction of stock market data with overlays of financial graphs and diagrams, underscored by a gray color palette, captures the intricacies of global business operations and data processing. Perfect for illustrating concepts related to business analytics, trading strategies, financial markets, or economic trends in presentations, articles, or educational materials.
Powered by 


2
downloads
downloads
Tags:
More
Credit Photo
If you would like to credit the Photo, here are some ways you can do so
Text Link
photo Link
<span class="text-link">
<span>
<a target="_blank" href=https://pikwizard.com/photo/stock-market-data-with-graphs-and-diagrams-in-gray-tones/fe33dded098c5c84798f322370f10c3a/>PikWizard</a>
</span>
</span>
<span class="image-link">
<span
style="margin: 0 0 20px 0; display: inline-block; vertical-align: middle; width: 100%;"
>
<a
target="_blank"
href="https://pikwizard.com/photo/stock-market-data-with-graphs-and-diagrams-in-gray-tones/fe33dded098c5c84798f322370f10c3a/"
style="text-decoration: none; font-size: 10px; margin: 0;"
>
<img src="https://pikwizard.com/pw/medium/fe33dded098c5c84798f322370f10c3a.jpg" style="margin: 0; width: 100%;" alt="" />
<p style="font-size: 12px; margin: 0;">PikWizard</p>
</a>
</span>
</span>
Free (free of charge)
Free for personal and commercial use.
Author: Authentic Images
Similar Free Stock Images

Premium


Premium


Premium


Premium


Premium


Premium


Premium


Premium


Premium


Premium


Premium


Premium


Premium


Premium


Premium


Premium


Premium


Premium


Premium


Premium


Premium


Premium


Premium


Premium