- Home >
- Stock Photos >
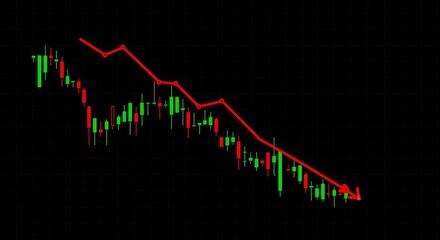
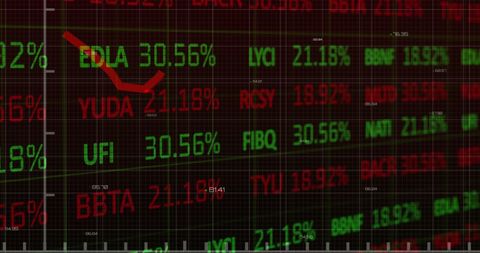
- Stock Market Decline Display with Falling Red Graph Line
Stock Market Decline Display with Falling Red Graph Line Image

A digital display illustrates a market decline, emphasized by a prominent red downward graph line amidst numeric data in green and red over a black background. Ideal for use in articles or presentations about financial crises, stock market trends, investment risks, and economic instability topics.
Powered by 


2
downloads
downloads
Tags:
More
Credit Photo
If you would like to credit the Photo, here are some ways you can do so
Text Link
photo Link
<span class="text-link">
<span>
<a target="_blank" href=https://pikwizard.com/photo/stock-market-decline-display-with-falling-red-graph-line/ae1d3404b368a2b042093868f09975c5/>PikWizard</a>
</span>
</span>
<span class="image-link">
<span
style="margin: 0 0 20px 0; display: inline-block; vertical-align: middle; width: 100%;"
>
<a
target="_blank"
href="https://pikwizard.com/photo/stock-market-decline-display-with-falling-red-graph-line/ae1d3404b368a2b042093868f09975c5/"
style="text-decoration: none; font-size: 10px; margin: 0;"
>
<img src="https://pikwizard.com/pw/medium/ae1d3404b368a2b042093868f09975c5.jpg" style="margin: 0; width: 100%;" alt="" />
<p style="font-size: 12px; margin: 0;">PikWizard</p>
</a>
</span>
</span>
Free (free of charge)
Free for personal and commercial use.
Author: Authentic Images
Similar Free Stock Images

Premium


Premium


Premium


Premium


Premium


Premium


Premium


Premium


Premium


Premium


Premium


Premium


Premium


Premium


Premium


Premium


Premium


Premium


Premium


Premium


Premium


Premium


Premium


Premium


Premium