- Home >
- Stock Photos >
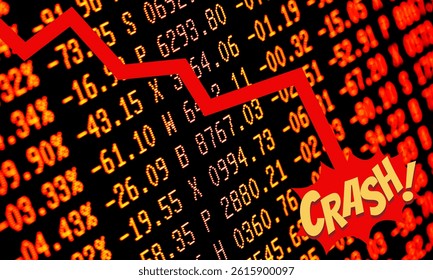
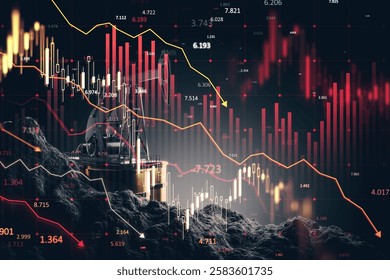
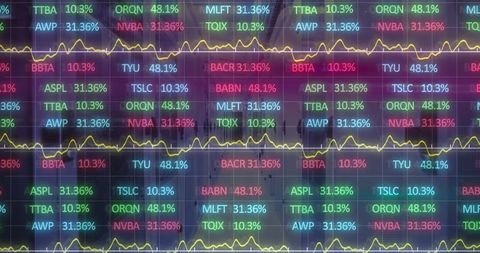
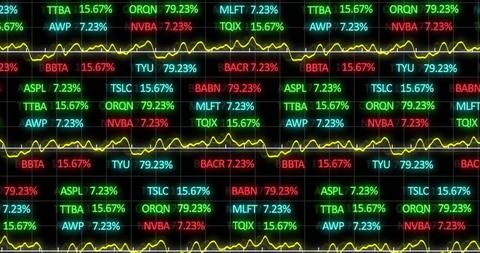
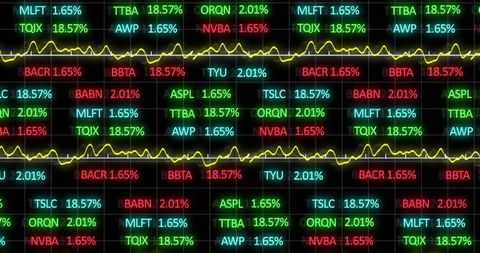
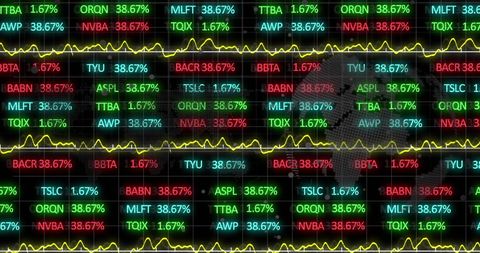
- Stock Market Decline Represented by Red Arrow and Ticker Data
Stock Market Decline Represented by Red Arrow and Ticker Data Image

Display shows financial ticker symbols and graphs, red arrow points downward signaling a market decline. Useful for illustrating economic downturn, market analytics, financial reporting, and investment analysis articles or presentations.
Powered by  - Get 15% off with code: PIKWIZARD15


0
downloads
downloads
Tags:
More
Credit Photo
If you would like to credit the Photo, here are some ways you can do so
Text Link
photo Link
<span class="text-link">
<span>
<a target="_blank" href=https://pikwizard.com/photo/stock-market-decline-represented-by-red-arrow-and-ticker-data/0cf0f70523983bbb77de89912a6a22ed/>PikWizard</a>
</span>
</span>
<span class="image-link">
<span
style="margin: 0 0 20px 0; display: inline-block; vertical-align: middle; width: 100%;"
>
<a
target="_blank"
href="https://pikwizard.com/photo/stock-market-decline-represented-by-red-arrow-and-ticker-data/0cf0f70523983bbb77de89912a6a22ed/"
style="text-decoration: none; font-size: 10px; margin: 0;"
>
<img src="https://pikwizard.com/pw/medium/0cf0f70523983bbb77de89912a6a22ed.jpg" style="margin: 0; width: 100%;" alt="" />
<p style="font-size: 12px; margin: 0;">PikWizard</p>
</a>
</span>
</span>
Free (free of charge)
Free for personal and commercial use.
Author: Creative Art
Similar Free Stock Images
Loading...

Premium


Premium

Premium


Premium


Premium

Premium


Premium

Premium

Premium


Premium

Premium

Premium


Premium


Premium


Premium


Premium


Premium

Premium


Premium


Premium


Premium

Premium

Premium

Premium


Premium