
- Home >
- Stock Photos >
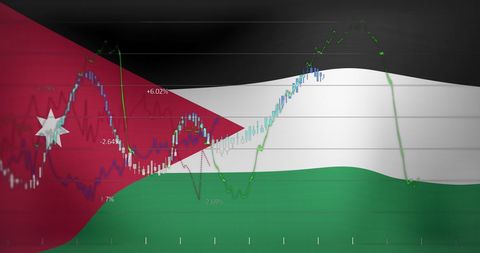
- Stock Market Fluctuation OverMap and Flag of China
Stock Market Fluctuation OverMap and Flag of China Image
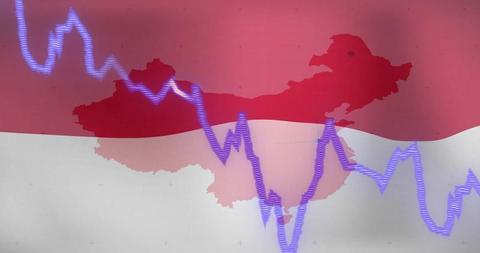
Symbolic representation of China's economic trends shows financial graphs extending over the map of China, illustrating stock market volatility and economic fluctuation against a red backdrop. Useful even for articles and reports focusing on financial markets, Chinese economy, or foreign investment dynamics.
Powered by  - Get 15% off with code: PIKWIZARD15


downloads
Tags:
More
Credit Photo
If you would like to credit the Photo, here are some ways you can do so
Text Link
photo Link
<span class="text-link">
<span>
<a target="_blank" href=https://pikwizard.com/photo/stock-market-fluctuation-overmap-and-flag-of-china/0de91cdaf3c7f88789746936a70ea37d/>PikWizard</a>
</span>
</span>
<span class="image-link">
<span
style="margin: 0 0 20px 0; display: inline-block; vertical-align: middle; width: 100%;"
>
<a
target="_blank"
href="https://pikwizard.com/photo/stock-market-fluctuation-overmap-and-flag-of-china/0de91cdaf3c7f88789746936a70ea37d/"
style="text-decoration: none; font-size: 10px; margin: 0;"
>
<img src="https://pikwizard.com/pw/medium/0de91cdaf3c7f88789746936a70ea37d.jpg" style="margin: 0; width: 100%;" alt="" />
<p style="font-size: 12px; margin: 0;">PikWizard</p>
</a>
</span>
</span>
Free (free of charge)
Free for personal and commercial use.
Author: People Creations
Similar Free Stock Images
Loading...

Premium


Premium


Premium


Premium


Premium

Premium
Premium


Premium

Premium


Premium


Premium

Premium

Premium


Premium

Premium

Premium


Premium


Premium

Premium

Premium

Premium

Premium


Premium


Premium

Premium


Explore More Free Stock Images