
- Home >
- Stock Photos >
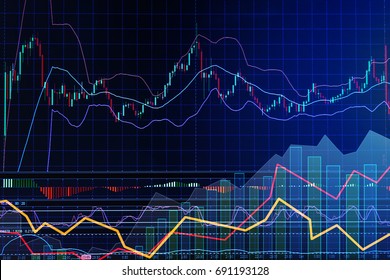
- Stock Market Graph with Fluctuations and Financial Data
Stock Market Graph with Fluctuations and Financial Data Image

Illustrates dynamic stock market activity with fluctuating graph lines against a backdrop of colorful numbers and stock symbols. Useful for depicting financial analysis, market trends, and investment studies. Ideal for articles, blogs, or reports on economic forecasting and stock trading narratives.
Powered by  - Get 15% off with code: PIKWIZARD15


2
downloads
downloads
Tags:
More
Credit Photo
If you would like to credit the Photo, here are some ways you can do so
Text Link
photo Link
<span class="text-link">
<span>
<a target="_blank" href=https://pikwizard.com/photo/stock-market-graph-with-fluctuations-and-financial-data/ba2444db8b1567ae503ebda0df856907/>PikWizard</a>
</span>
</span>
<span class="image-link">
<span
style="margin: 0 0 20px 0; display: inline-block; vertical-align: middle; width: 100%;"
>
<a
target="_blank"
href="https://pikwizard.com/photo/stock-market-graph-with-fluctuations-and-financial-data/ba2444db8b1567ae503ebda0df856907/"
style="text-decoration: none; font-size: 10px; margin: 0;"
>
<img src="https://pikwizard.com/pw/medium/ba2444db8b1567ae503ebda0df856907.jpg" style="margin: 0; width: 100%;" alt="" />
<p style="font-size: 12px; margin: 0;">PikWizard</p>
</a>
</span>
</span>
Free (free of charge)
Free for personal and commercial use.
Author: Authentic Images
Similar Free Stock Images

Premium


Premium


Premium


Premium


Premium


Premium


Premium


Premium


Premium


Premium


Premium


Premium


Premium


Premium


Premium


Premium


Premium


Premium


Premium


Premium


Premium


Premium


Premium


Premium


Premium

