- Home >
- Stock Photos >
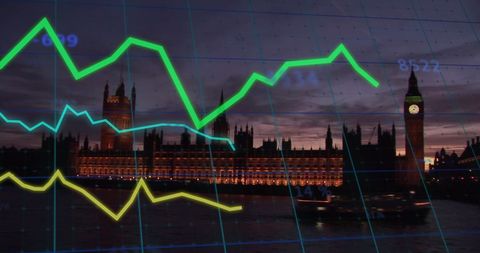
- Stock Market Graphs Overlaying Urban Cityscape at Dusk
Stock Market Graphs Overlaying Urban Cityscape at Dusk Image

Visual depiction combines digital stock market data with evocative urban cityscape, highlighting connections between global finance and modern cities. Use in content exploring trends in the economy, advances in digital interfaces for financial trading, or keynote presentations about investment opportunities in an urban economy.
Powered by  - Get 15% off with code: PIKWIZARD15


4
downloads
downloads
Tags:
More
Credit Photo
If you would like to credit the Photo, here are some ways you can do so
Text Link
photo Link
<span class="text-link">
<span>
<a target="_blank" href=https://pikwizard.com/photo/stock-market-graphs-overlaying-urban-cityscape-at-dusk/e3efaf50ad62e84e8b51b94c436f5563/>PikWizard</a>
</span>
</span>
<span class="image-link">
<span
style="margin: 0 0 20px 0; display: inline-block; vertical-align: middle; width: 100%;"
>
<a
target="_blank"
href="https://pikwizard.com/photo/stock-market-graphs-overlaying-urban-cityscape-at-dusk/e3efaf50ad62e84e8b51b94c436f5563/"
style="text-decoration: none; font-size: 10px; margin: 0;"
>
<img src="https://pikwizard.com/pw/medium/e3efaf50ad62e84e8b51b94c436f5563.jpg" style="margin: 0; width: 100%;" alt="" />
<p style="font-size: 12px; margin: 0;">PikWizard</p>
</a>
</span>
</span>
Free (free of charge)
Free for personal and commercial use.
Author: Creative Art
Similar Free Stock Images
Loading...

Premium


Premium

Premium

Premium


Premium

Premium


Premium


Premium


Premium


Premium


Premium

Premium


Premium


Premium

Premium

Premium


Premium

Premium

Premium


Premium


Premium


Premium


Premium


Premium


Premium