- Home >
- Stock Photos >
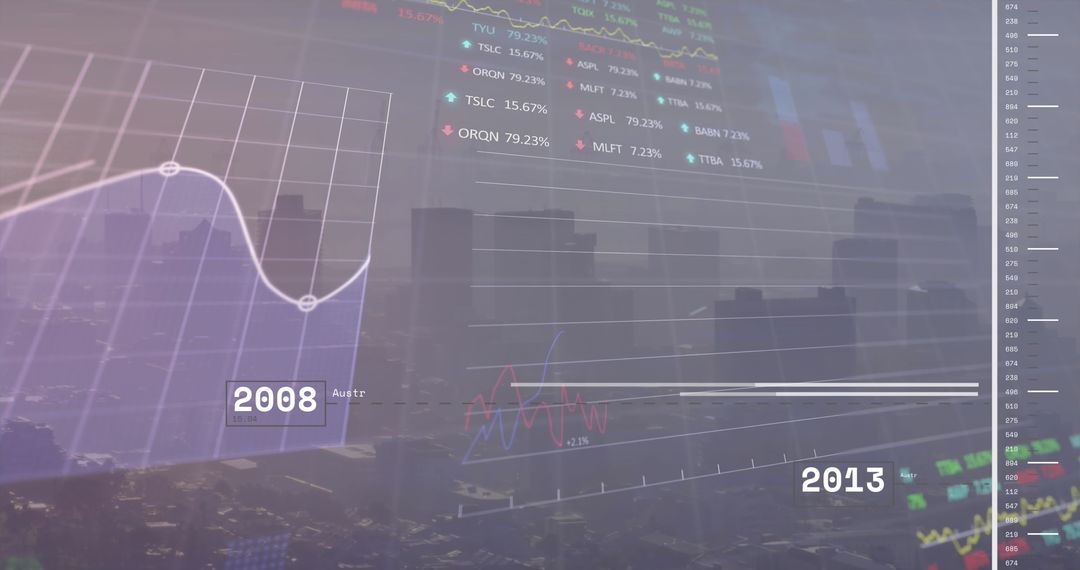
- Stock Market Growth Display with Colorful Charts and Graphs
Stock Market Growth Display with Colorful Charts and Graphs Image

This visually engaging representation of stock market activity depicts colorful charts and graphs demonstrating stock movement over time. Useful for presentations on financial analysis, educational purposes about market trends, or articles discussing investment strategies, this digital finance imagery strongly communicates market dynamics to engage viewers and support data-driven narratives.
Powered by 


3
downloads
downloads
Tags:
More
Credit Photo
If you would like to credit the Photo, here are some ways you can do so
Text Link
photo Link
<span class="text-link">
<span>
<a target="_blank" href=https://pikwizard.com/photo/stock-market-growth-display-with-colorful-charts-and-graphs/e8c3c75500b20ce9e7a672c0b7ed0c8b/>PikWizard</a>
</span>
</span>
<span class="image-link">
<span
style="margin: 0 0 20px 0; display: inline-block; vertical-align: middle; width: 100%;"
>
<a
target="_blank"
href="https://pikwizard.com/photo/stock-market-growth-display-with-colorful-charts-and-graphs/e8c3c75500b20ce9e7a672c0b7ed0c8b/"
style="text-decoration: none; font-size: 10px; margin: 0;"
>
<img src="https://pikwizard.com/pw/medium/e8c3c75500b20ce9e7a672c0b7ed0c8b.jpg" style="margin: 0; width: 100%;" alt="" />
<p style="font-size: 12px; margin: 0;">PikWizard</p>
</a>
</span>
</span>
Free (free of charge)
Free for personal and commercial use.
Author: Creative Art
Similar Free Stock Images

Premium


Premium


Premium


Premium


Premium


Premium


Premium


Premium


Premium


Premium


Premium


Premium


Premium


Premium


Premium


Premium


Premium


Premium


Premium


Premium


Premium


Premium


Premium


Premium