
- Home >
- Stock Photos >
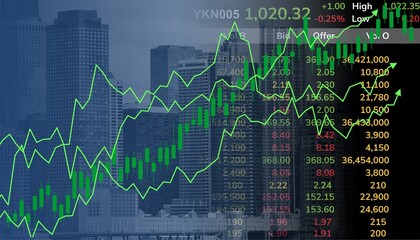
- Stock Market Growth Visualization on Candlestick Chart
Stock Market Growth Visualization on Candlestick Chart Image

This visualization of stock market performance using a candlestick chart is ideal for representing trends in finance, trading, and economics. The colorful lines and graph marks on a dark background illustrate price changes and market fluctuations, making it suitable for use in articles, presentations, and reports on financial analysis, investment strategies, or market overviews. Businesses, educators, and forex traders might find this useful for educational purposes or client briefings.
Powered by 


downloads
Tags:
More
Credit Photo
If you would like to credit the Photo, here are some ways you can do so
Text Link
photo Link
<span class="text-link">
<span>
<a target="_blank" href=https://pikwizard.com/photo/stock-market-growth-visualization-on-candlestick-chart/4211bb1365a9d28f6a45f4d070d32193/>PikWizard</a>
</span>
</span>
<span class="image-link">
<span
style="margin: 0 0 20px 0; display: inline-block; vertical-align: middle; width: 100%;"
>
<a
target="_blank"
href="https://pikwizard.com/photo/stock-market-growth-visualization-on-candlestick-chart/4211bb1365a9d28f6a45f4d070d32193/"
style="text-decoration: none; font-size: 10px; margin: 0;"
>
<img src="https://pikwizard.com/pw/medium/4211bb1365a9d28f6a45f4d070d32193.jpg" style="margin: 0; width: 100%;" alt="" />
<p style="font-size: 12px; margin: 0;">PikWizard</p>
</a>
</span>
</span>
Free (free of charge)
Free for personal and commercial use.
Author: People Creations
Similar Free Stock Images
Loading...

Premium


Premium

Premium


Premium


Premium


Premium


Premium


Premium


Premium


Premium


Premium

Premium


Premium


Premium

Premium


Premium


Premium

Premium


Premium


Premium


Premium


Premium


Premium

Premium

Premium


Explore More Free Stock Images