
- Home >
- Stock Photos >
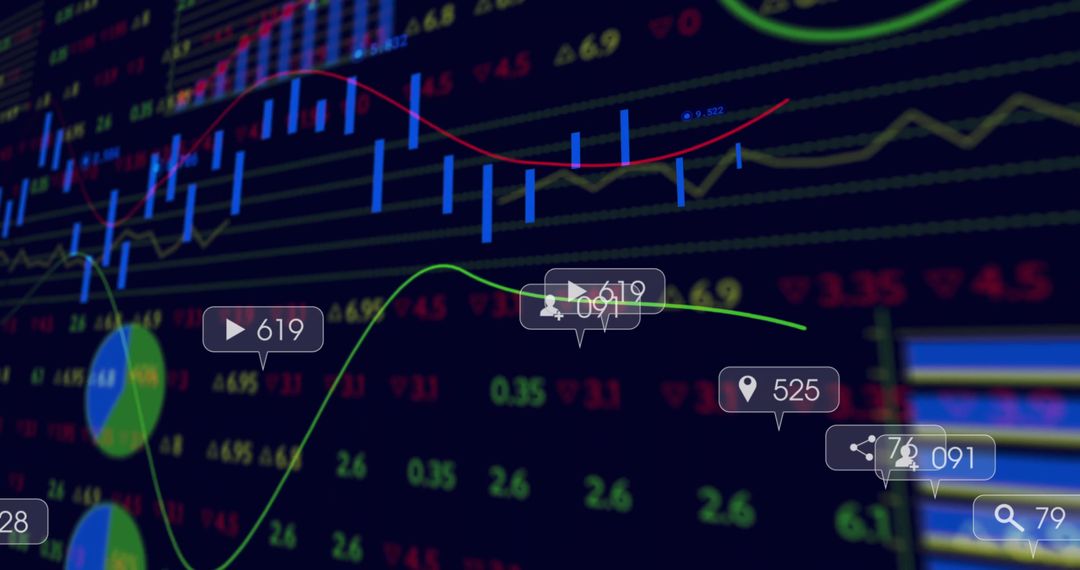
- Stock Market Trends and Data Visualization in Digital Interface
Stock Market Trends and Data Visualization in Digital Interface Image

Illustrates complex financial market data and trends with colorful graphs and numerical values digitally displayed on dark background. Perfect for financial blogs, stock market analysis articles, investment portfolios, and educational materials on economic dynamics or data science.
Powered by  - Get 15% off with code: PIKWIZARD15


2
downloads
downloads
Tags:
More
Credit Photo
If you would like to credit the Photo, here are some ways you can do so
Text Link
photo Link
<span class="text-link">
<span>
<a target="_blank" href=https://pikwizard.com/photo/stock-market-trends-and-data-visualization-in-digital-interface/cdd376bc15bcc49f14926adb12f93c9b/>PikWizard</a>
</span>
</span>
<span class="image-link">
<span
style="margin: 0 0 20px 0; display: inline-block; vertical-align: middle; width: 100%;"
>
<a
target="_blank"
href="https://pikwizard.com/photo/stock-market-trends-and-data-visualization-in-digital-interface/cdd376bc15bcc49f14926adb12f93c9b/"
style="text-decoration: none; font-size: 10px; margin: 0;"
>
<img src="https://pikwizard.com/pw/medium/cdd376bc15bcc49f14926adb12f93c9b.jpg" style="margin: 0; width: 100%;" alt="" />
<p style="font-size: 12px; margin: 0;">PikWizard</p>
</a>
</span>
</span>
Free (free of charge)
Free for personal and commercial use.
Author: Awesome Content
Similar Free Stock Images

Premium


Premium


Premium


Premium


Premium


Premium


Premium


Premium


Premium


Premium


Premium


Premium


Premium


Premium


Premium


Premium


Premium


Premium


Premium


Premium


Premium


Premium


Premium


Premium

