- Home >
- Stock Photos >
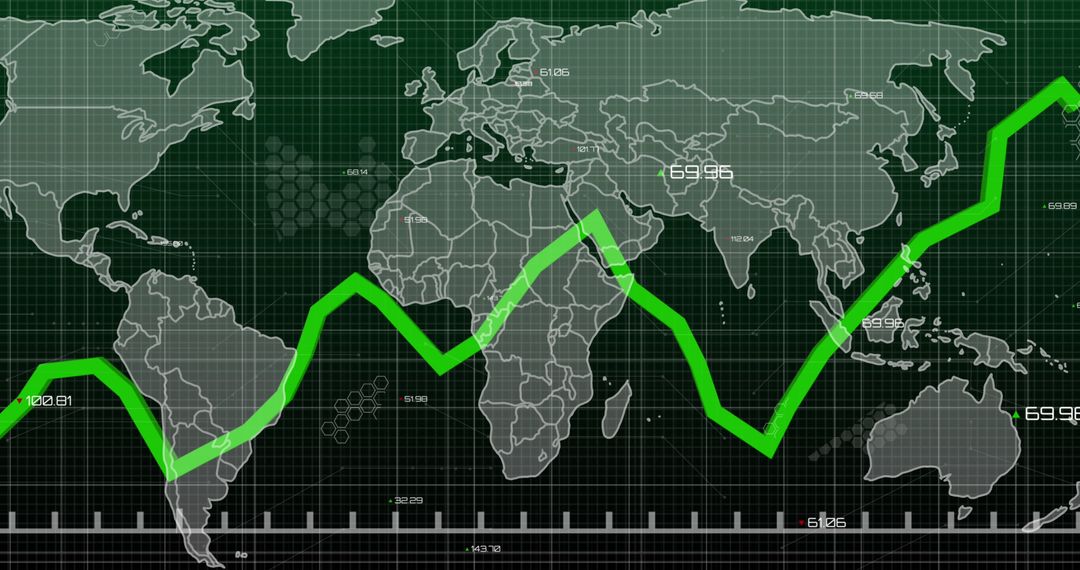
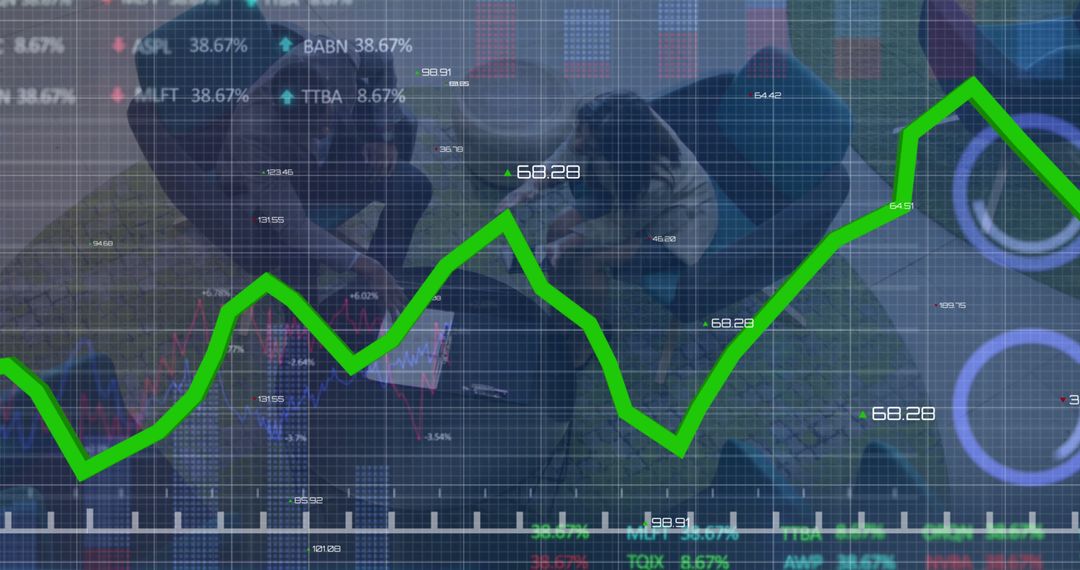
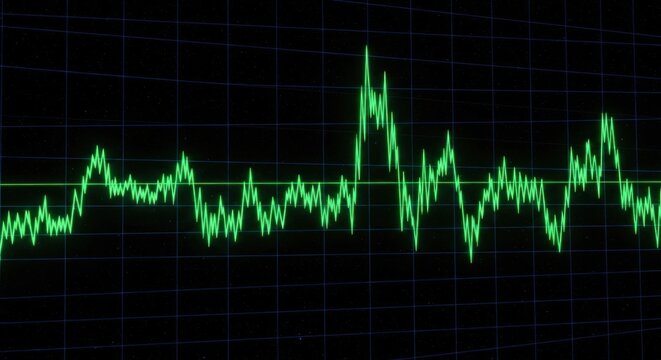
- Stock Market Trends Digital Display with Fluctuating Graph
Stock Market Trends Digital Display with Fluctuating Graph Image

This illustration of a fluctuating stock market graph on a digital display provides a modern and dynamic representation of financial trends. Ideal for use in articles related to finance, investment strategies, economic analysis, trading insights, or data analytics. Suitable for financial reports and presentations to depict market fluctuations or economic conditions.
Powered by 


2
downloads
downloads
Tags:
More
Credit Photo
If you would like to credit the Photo, here are some ways you can do so
Text Link
photo Link
<span class="text-link">
<span>
<a target="_blank" href=https://pikwizard.com/photo/stock-market-trends-digital-display-with-fluctuating-graph/fcf70d6f597e669ef73b849df03cda89/>PikWizard</a>
</span>
</span>
<span class="image-link">
<span
style="margin: 0 0 20px 0; display: inline-block; vertical-align: middle; width: 100%;"
>
<a
target="_blank"
href="https://pikwizard.com/photo/stock-market-trends-digital-display-with-fluctuating-graph/fcf70d6f597e669ef73b849df03cda89/"
style="text-decoration: none; font-size: 10px; margin: 0;"
>
<img src="https://pikwizard.com/pw/medium/fcf70d6f597e669ef73b849df03cda89.jpg" style="margin: 0; width: 100%;" alt="" />
<p style="font-size: 12px; margin: 0;">PikWizard</p>
</a>
</span>
</span>
Free (free of charge)
Free for personal and commercial use.
Author: Creative Art
Similar Free Stock Images

Premium


Premium


Premium


Premium


Premium


Premium


Premium


Premium


Premium


Premium


Premium


Premium


Premium


Premium


Premium


Premium


Premium


Premium


Premium


Premium


Premium


Premium


Premium


Premium