- Home >
- Stock Photos >
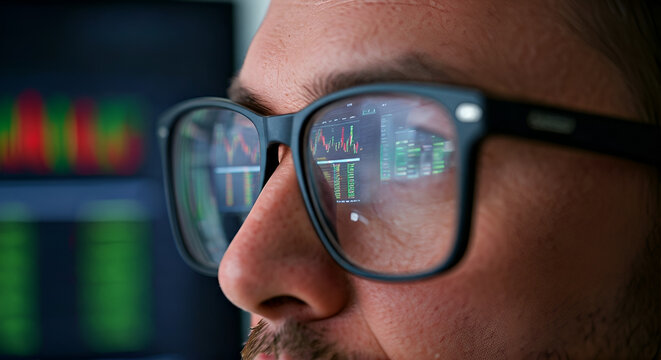
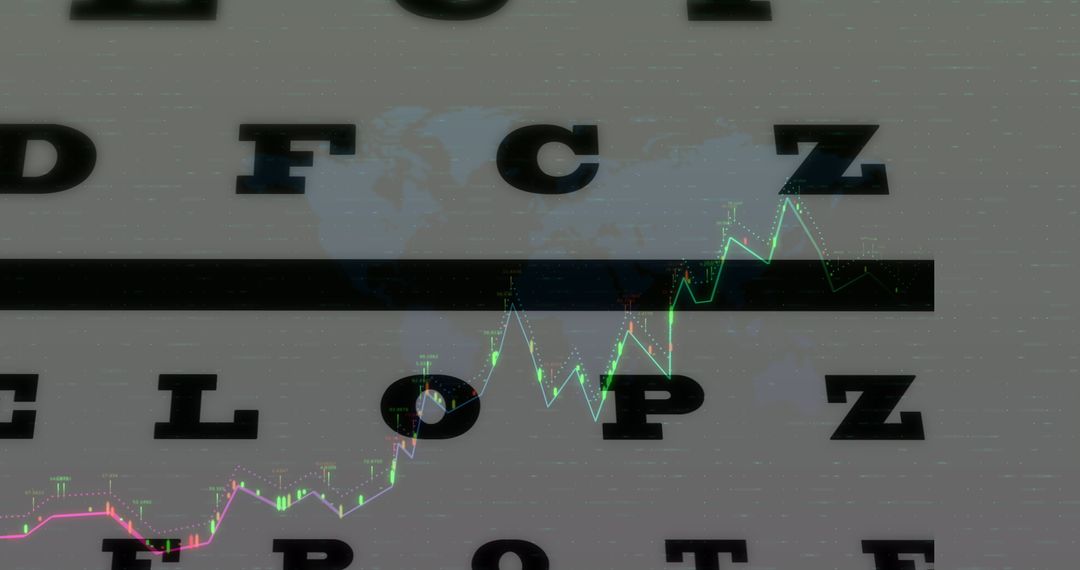
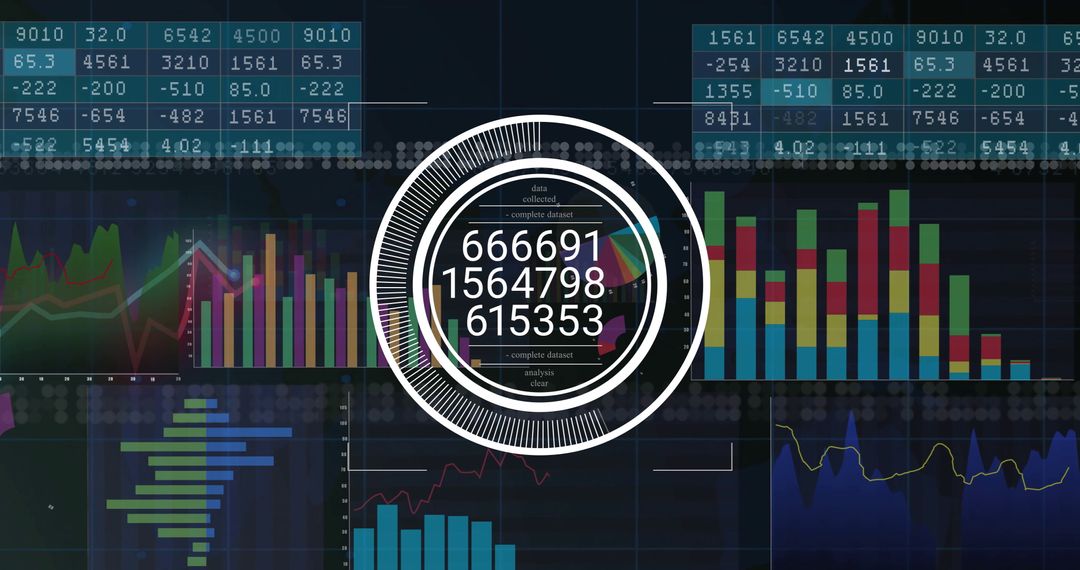
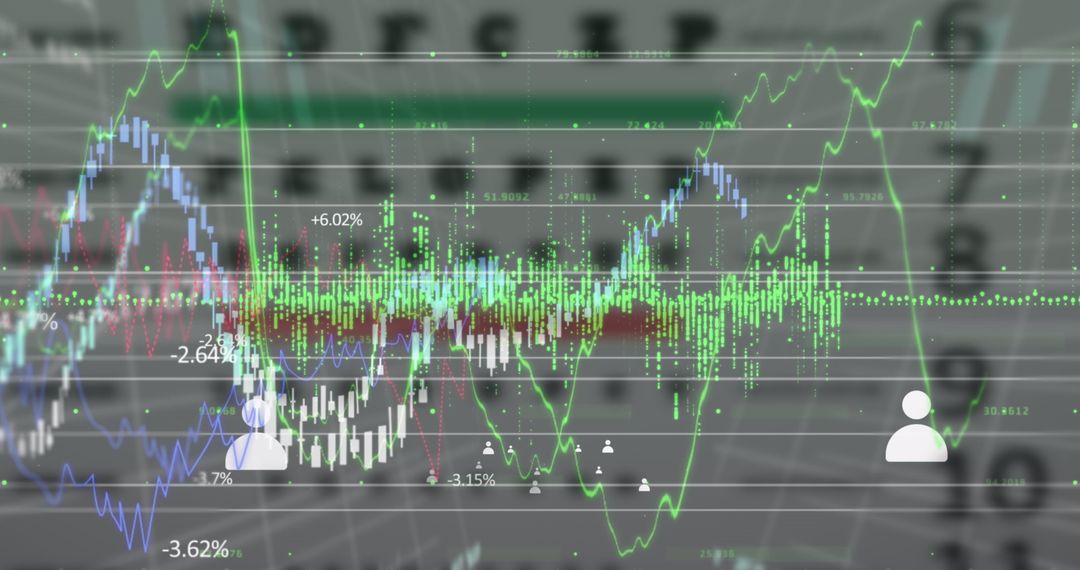
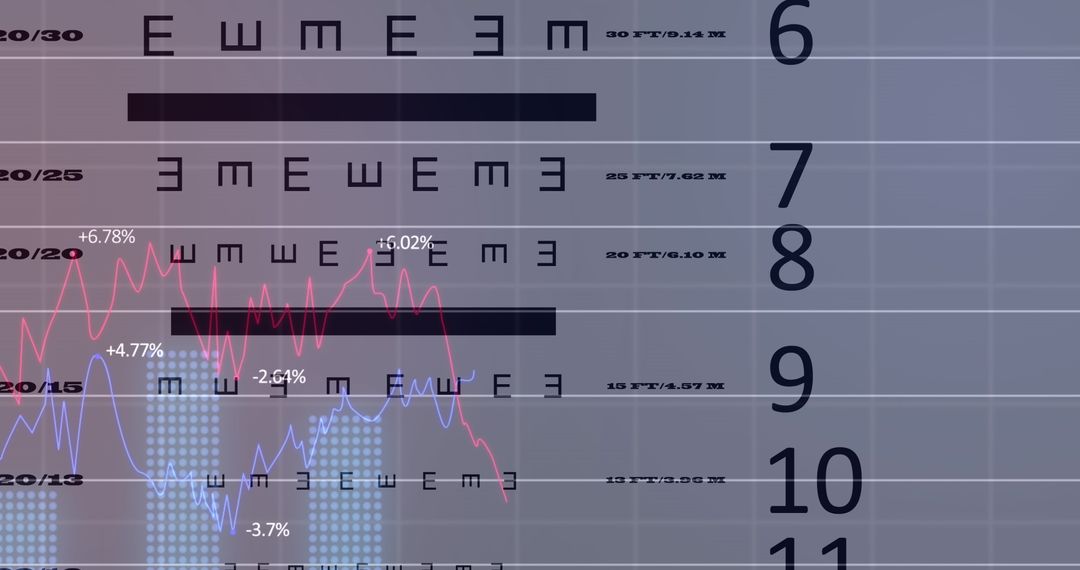
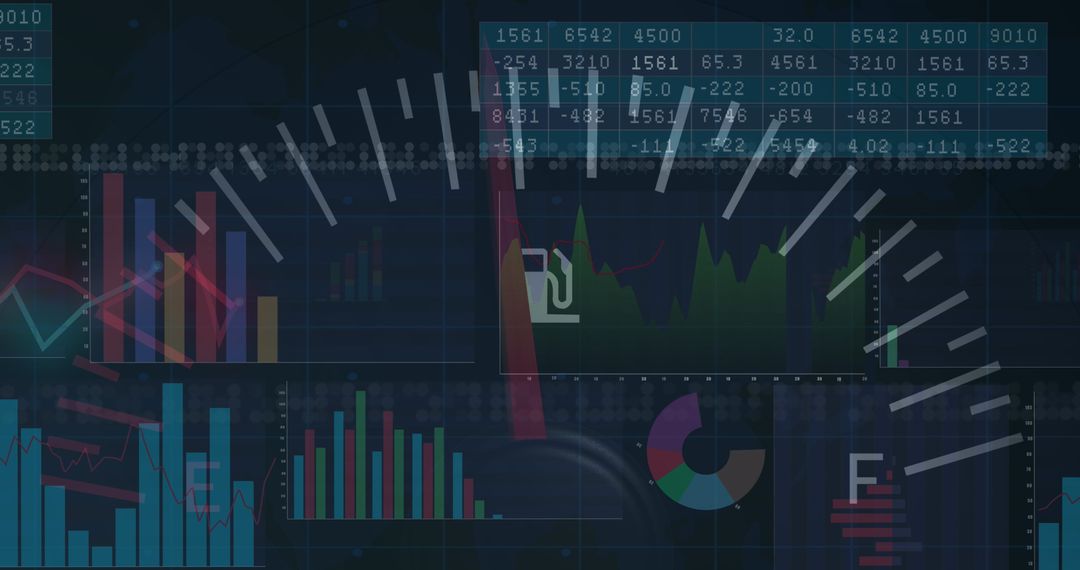
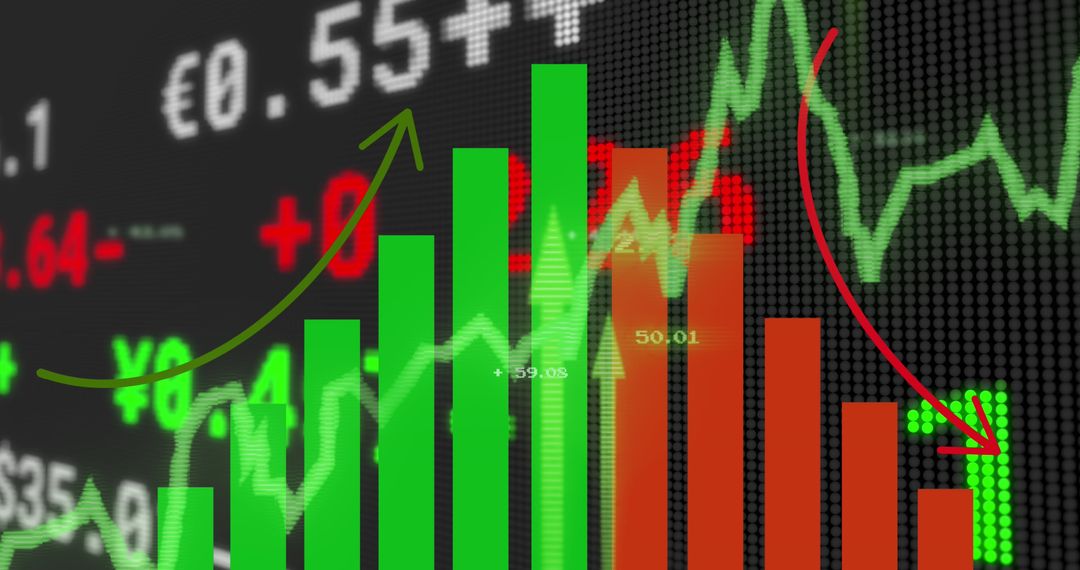
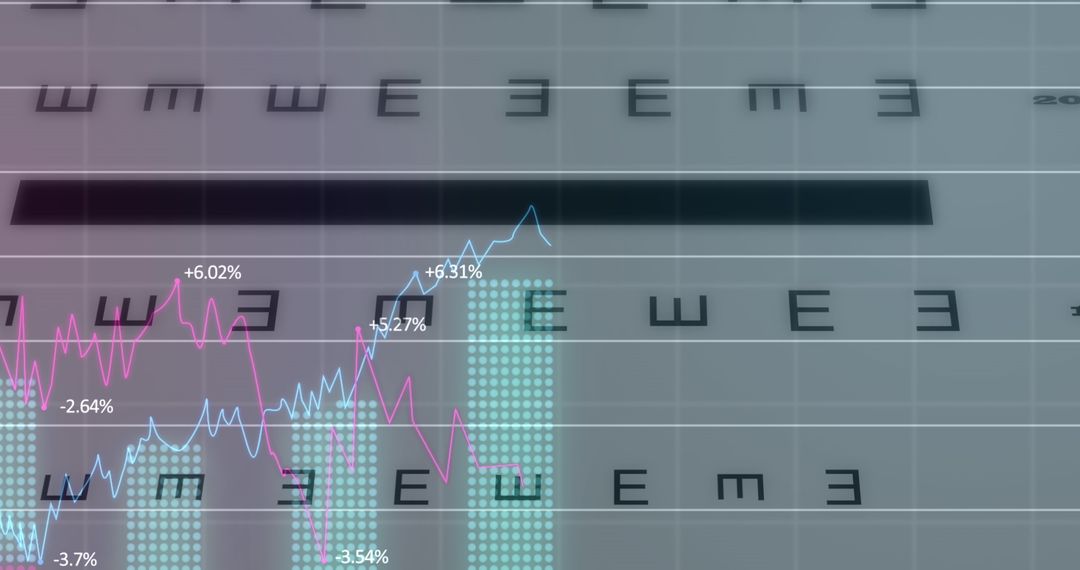
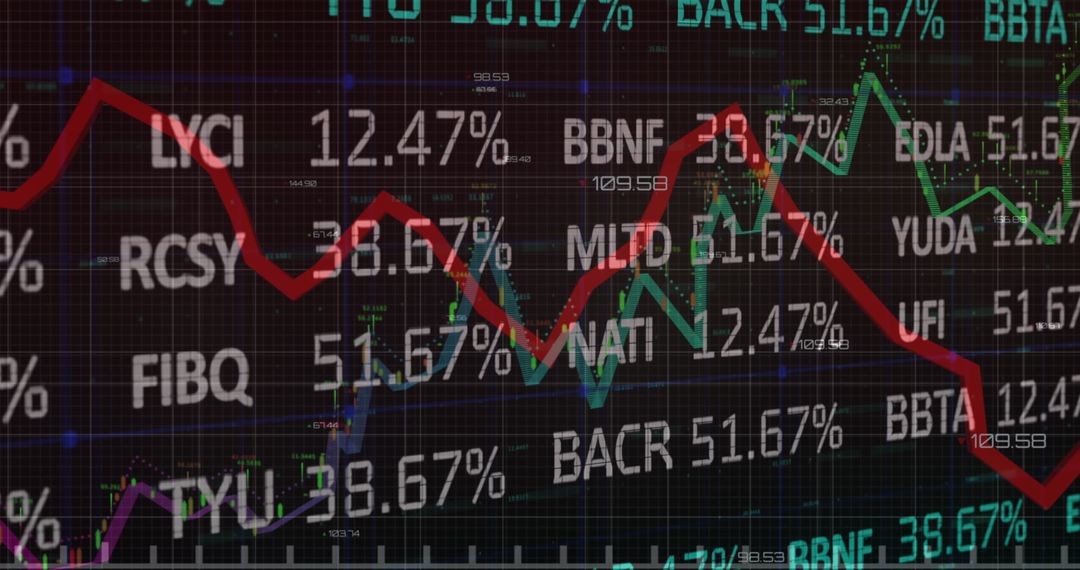
- Stock Market Trends Merged with Vision Test Chart Illustration
Stock Market Trends Merged with Vision Test Chart Illustration Image
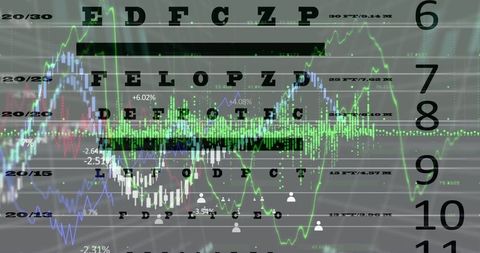
Technology and finance intersect in this unique illustration blending stock market trends with an eye chart. This visual metaphor is ideal for articles or presentations about perceptual finance, data interpretation, or investment strategies. Inspiring for use in digital marketing campaigns and financial advisory ventures to emphasize clarity and attention in markets.
Powered by 


2
downloads
downloads
Tags:
More
Credit Photo
If you would like to credit the Photo, here are some ways you can do so
Text Link
photo Link
<span class="text-link">
<span>
<a target="_blank" href=https://pikwizard.com/photo/stock-market-trends-merged-with-vision-test-chart-illustration/bcc973b8b37b4ddc41ea4ab1d10c710c/>PikWizard</a>
</span>
</span>
<span class="image-link">
<span
style="margin: 0 0 20px 0; display: inline-block; vertical-align: middle; width: 100%;"
>
<a
target="_blank"
href="https://pikwizard.com/photo/stock-market-trends-merged-with-vision-test-chart-illustration/bcc973b8b37b4ddc41ea4ab1d10c710c/"
style="text-decoration: none; font-size: 10px; margin: 0;"
>
<img src="https://pikwizard.com/pw/medium/bcc973b8b37b4ddc41ea4ab1d10c710c.jpg" style="margin: 0; width: 100%;" alt="" />
<p style="font-size: 12px; margin: 0;">PikWizard</p>
</a>
</span>
</span>
Free (free of charge)
Free for personal and commercial use.
Author: Awesome Content
Similar Free Stock Images

Premium


Premium


Premium


Premium


Premium


Premium


Premium


Premium


Premium


Premium


Premium


Premium


Premium


Premium


Premium


Premium


Premium


Premium


Premium


Premium


Premium


Premium


Premium


Premium