1. Home > 
  2. Stock Photos > 
  3. Stock Market Trends Over Gambia Flag and World Map Illustration

Stock Market Trends Over Gambia Flag and World Map Illustration Image

Stock Market Trends Over Gambia Flag and World Map Illustration

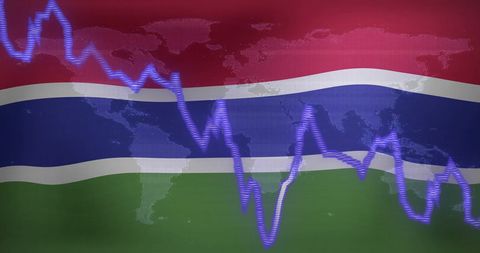
Vibrant visual showing stock market trends displayed over the Gambia flag, suggesting an interaction between local and global economic actions. The world map in the background connects this narrative on a broader scale. Perfect for use in finance themed projects, economic analyses reports, and business presentations focusing on Gambia or global economic trends.

Powered by Shutterstock logo - Get 15% off with code: PIKWIZARD15
Gambia flag, stock market, exchange economy and Trade, oil production, container ship in export and import business and logistics. - Powered by Shutterstock - Get 15% off with code: PIKWIZARD15

Credit Photo

If you would like to credit the Photo, here are some ways you can do so

Free (free of charge)

Free for personal and commercial use.

Author: People Creations

Similar Free Stock Images

Green Heart Rate Monitor Wave Light Effect
Digital Financial Data Visualization in Server Environment
Abstract Sound Waves on Dark Background
Digital Data Processing with Loading Bar on Blue Background
Stagflation Concept with Financial Market Downturn
Digital Financial Data on Server with Stock Market Graph
Digital Financial Data Processing Over New Zealand Flag
Andorra Flag with Digital Graph and Stagflation Concept
Slumpflation Concept on Armenian Flag Background
USA Economic Data and Stagflation Charts Overlapping American Flag
Stagflation with Polish Economic Data Visualization
Abstract Financial Chart Over Modern Cityscape
Italian Economic Growth Concept with Flag and Financial Charts
Energy Market Analysis with USA Flag and Graphs
Stagflation Concept Overlay on Financial Graphs with Digital Data
Slumpflation Concept with Graph and Digital Display
Digital Network Connections and Data Processing Illustrative Graphic
Abstract Data Visualization Graph on Blurred Background
Dynamic Financial Data Visualizations on Grid Interface
Digital Data Stream and Holographic Analysis Visualization
Dynamic Financial Stock Market Graph
Global Networking Concept with 6G Technology Display
Cityscape with Digital Stock Market Graphs and Statistics
Digitized Medical Data Overlay with Cardio Graph and Medicine
Financial Stock Market Data Visualization with Declining Trends
Glowing Green Heart Rate Monitor Wave on Black Background
Business Growth Concept with Graphs Overlay in Warehouse
USA Economic Trends with Patriotic Symbols Overlay
Neon Green Electrocardiogram Wave on Black Background
Stagflation Concept with Financial Data Coding Overlay
Greece Inflation Data and Increasing Graph Concept
New Zealand Flag with Data Visualization Overlay
Stagflation Concept With Latvia Flag and Chart
Global Economy Displaying Growth Trends with Ukraine-NATO Financial Outlook
Stagflation Text on Bahrain Flag with Rising Graph
Chilean Flag Overlaying Stock Market Inflation Trends
Dynamic Data Processing With Busy City Background
Abstract Financial Graph with Rising Waves on Red Gradient
Dynamic Graphs Overlay on Data Center Servers Illustrating Technology Impact
Stagflation Concept with Digital Financial Graphs
Digital DNA Strand Overlaid with Scientific Data Patterns
Dynamic Data Wave Over Red Background with Digital Patterns
Analyzing Stock Market Trends with Dynamic Graphs and Data
Digital Cardiograph Overlay on Treadmill Workout
Data Visualization with Rising Red Arrow and Floating Numbers
Dynamic Green Stock Market Chart with Upward Arrows
Glowing Financial Graph of Stock Market Trends on Digital Screen
Abstract Circuit Brain with Financial Growth Concept
Digital Data Visualization Over Server Rows
Dynamic Stock Market Chart with Fluctuating Trends and Data Points
Line Graphs on Digital Background Show Financial Data Trends
Colorful Digital Waveform Represents Global Connections
Abstract Digital Waves on Blue Background with Grid
Glowing Cardiology Graph on Dark Background
Rising Graph with Digital Data Interface Analysis
France Stock Market Data Visualization Concept
Growing Economic Indicators on Brazil Flag Background
Slumpflation Concept with Australian Flag Background
Data Analysis Signs Stagflation on Costa Rica Flag Concept
Stagflation Concept Overlaid on Palestinian Flag Background
Economic Trends with Finnish Flag Overlay and Rising Graph
Abstract Neon Waves on Dark Background Concept
Optimized Statistical Data Overlain on Corporate Architecture
Surgeon Analyzing Vital Signs Holographic Interface in Hospital
Stagflation Concept with Red Graph Overlay on Cityscape
Dynamic Stock Market Chart with Trend Data Overlay
Dynamic Green Light Trails Representing Digital Data Waves
Dynamic Stock Market Graphs Over Digital Interface
Digital Finance Chart Overlaying Globe Background
City Skyline with Overlay of Financial Market Trends
Abstract Digital Waves Over Striped Background
Financial Data Processing with Green Digital Graph in Action
AI in Financial Data Processing with Red Graph Overlay
United Kingdom Flag Overlaying Data and Stock Chart
Digital Stock Market Graph Red Trendline on Green Background
Abstract Digital Financial Chart on Blue Background
Neon Network on Purple Background with Glowing Connectivity Lines
Economy and Finance Analytics on Benin Flag Background
Rising Stock Market Graph on Blue Financial Background
Abstract Financial Data Visualization in Server Room
Business Data Graphics Over New Zealand Flag
Stagflation Concept Overlapping Palestinian Flag and Data Charts
Stagflation Impact on Taiwan Economy With Graph Overlay
Stagflation Impact on Russian Economy Featuring Graph Overlay
Stagflation and Economic Analysis on Panama Flag Background
Dynamic Financial Growth Representing Business Trends
Data Analytics Overlay on Night City Road with Digital Interface
Digital Forex Data Over City Skyline Visualizing Market Trends
Dynamic Stagflation Concept Displaying Economic Burdens
Slumpflation Concept on Digital Financial Screen
Vibrant Heart Rate Display Over Group Outdoor Fitness Exercise
Gamepad Icon Overlaid on Financial Data Chart
Abstract Digital Finance Chart Showing Fluctuating Graph Lines
Dynamic Financial Data Waves in Digital Cyber World
Futuristic Digital Sound Wave on Blue Background
Digital Financial Analysis with Glowing Green Charts
Dynamic Financial Graphs Overlaying Urban Skyline
Financial Data Analysis with Futuristic Technology Interface
Stock Market Volatility Visualized Over American Flag
Colorful Waveforms on Blue Background