- Home >
- Stock Photos >
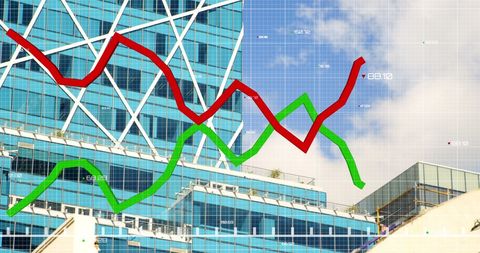
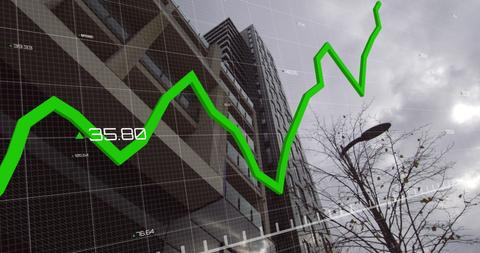
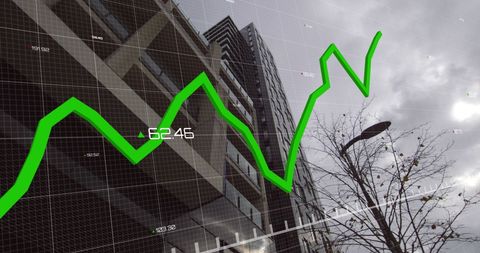
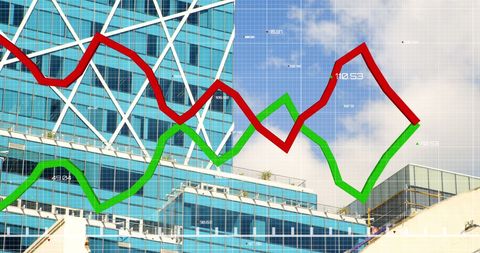
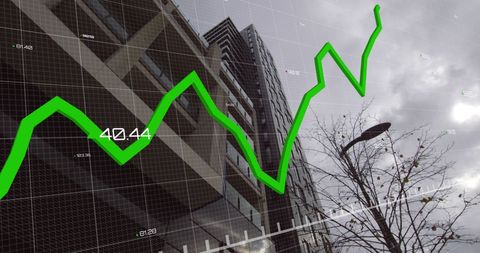
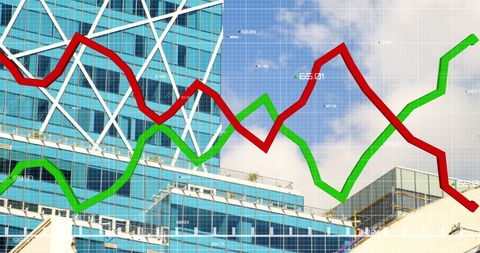
- Stock Market Trends with Upward and Downward Graph
Stock Market Trends with Upward and Downward Graph Image

Red and green lines representing stock market trends against a white background suggest a focus on financial analysis and global economic patterns. Useful for business presentations, financial reports, or educational materials focusing on market behavior and trading insights, illustrating digital transformation in data processing.
Powered by 


2
downloads
downloads
Tags:
More
Credit Photo
If you would like to credit the Photo, here are some ways you can do so
Text Link
photo Link
<span class="text-link">
<span>
<a target="_blank" href=https://pikwizard.com/photo/stock-market-trends-with-upward-and-downward-graph/06634e3ee1a2b617083435ed9a7c891d/>PikWizard</a>
</span>
</span>
<span class="image-link">
<span
style="margin: 0 0 20px 0; display: inline-block; vertical-align: middle; width: 100%;"
>
<a
target="_blank"
href="https://pikwizard.com/photo/stock-market-trends-with-upward-and-downward-graph/06634e3ee1a2b617083435ed9a7c891d/"
style="text-decoration: none; font-size: 10px; margin: 0;"
>
<img src="https://pikwizard.com/pw/medium/06634e3ee1a2b617083435ed9a7c891d.jpg" style="margin: 0; width: 100%;" alt="" />
<p style="font-size: 12px; margin: 0;">PikWizard</p>
</a>
</span>
</span>
Free (free of charge)
Free for personal and commercial use.
Author: People Creations
Similar Free Stock Images

Premium


Premium


Premium


Premium


Premium


Premium


Premium


Premium


Premium


Premium


Premium


Premium


Premium


Premium


Premium


Premium


Premium


Premium


Premium


Premium


Premium


Premium


Premium


Premium


Premium