- Home >
- Stock Photos >
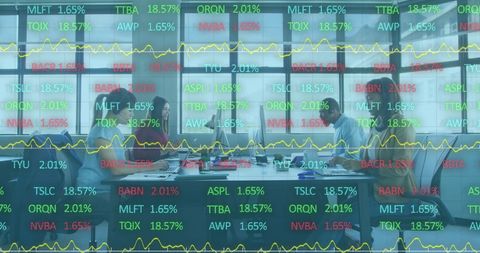
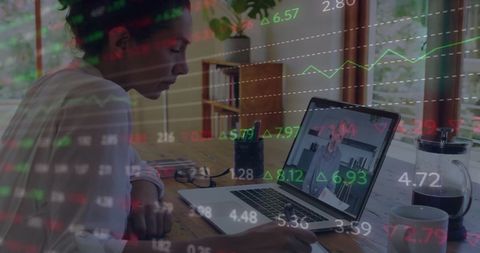
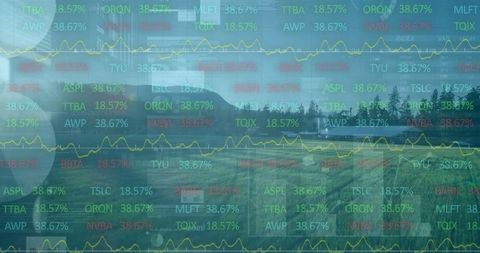
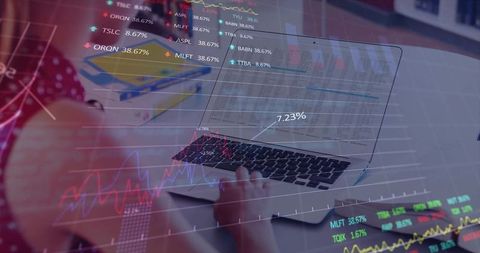
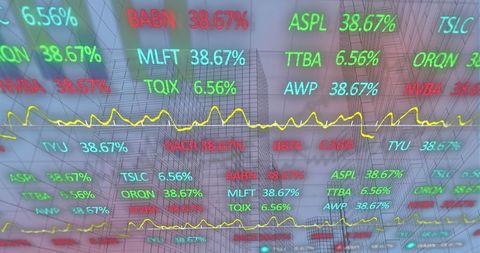
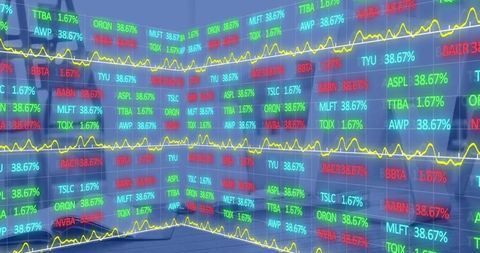
- Stock Ticker Data Overlapping Digital Workspace Concept
Stock Ticker Data Overlapping Digital Workspace Concept Image

This image shows colorful stock ticker data fluctuating across screens within a digital trading environment, intermixed with computer technology elements. It symbolizes the dynamic nature of global finance, investing and market analytics. It is ideal for use in articles or content related to stock trading, financial analysis, economics education, and technology in business.

downloads
Tags:
More
Credit Photo
If you would like to credit the Photo, here are some ways you can do so
Text Link
photo Link
<span class="text-link">
<span>
<a target="_blank" href=https://pikwizard.com/photo/stock-ticker-data-overlapping-digital-workspace-concept/01d7976bf3287713c539ce8f133ee17e/>PikWizard</a>
</span>
</span>
<span class="image-link">
<span
style="margin: 0 0 20px 0; display: inline-block; vertical-align: middle; width: 100%;"
>
<a
target="_blank"
href="https://pikwizard.com/photo/stock-ticker-data-overlapping-digital-workspace-concept/01d7976bf3287713c539ce8f133ee17e/"
style="text-decoration: none; font-size: 10px; margin: 0;"
>
<img src="https://pikwizard.com/pw/medium/01d7976bf3287713c539ce8f133ee17e.jpg" style="margin: 0; width: 100%;" alt="" />
<p style="font-size: 12px; margin: 0;">PikWizard</p>
</a>
</span>
</span>
Free (free of charge)
Free for personal and commercial use.
Author: Awesome Content