- Home >
- Stock Photos >
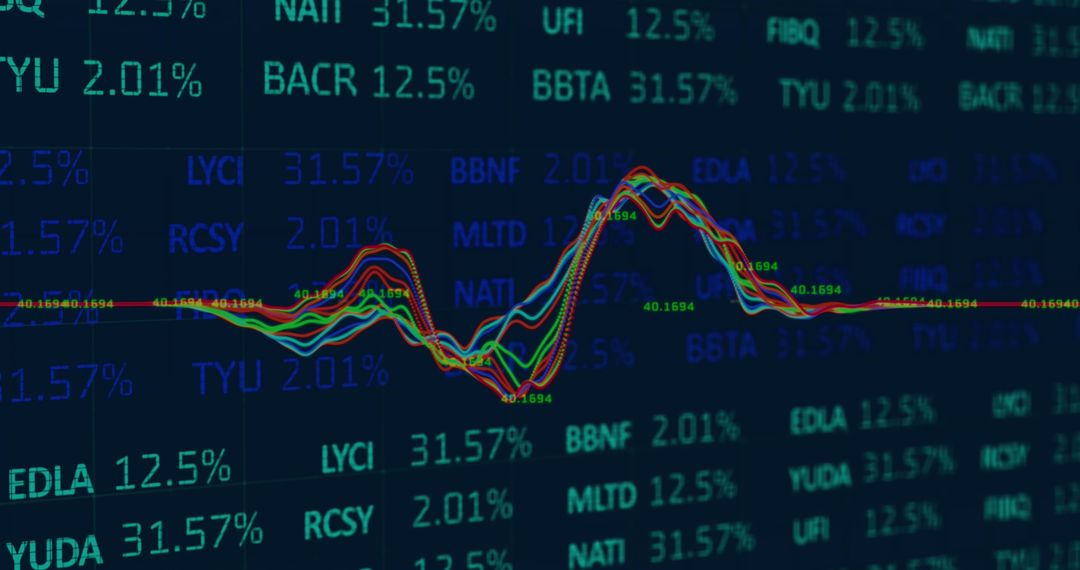
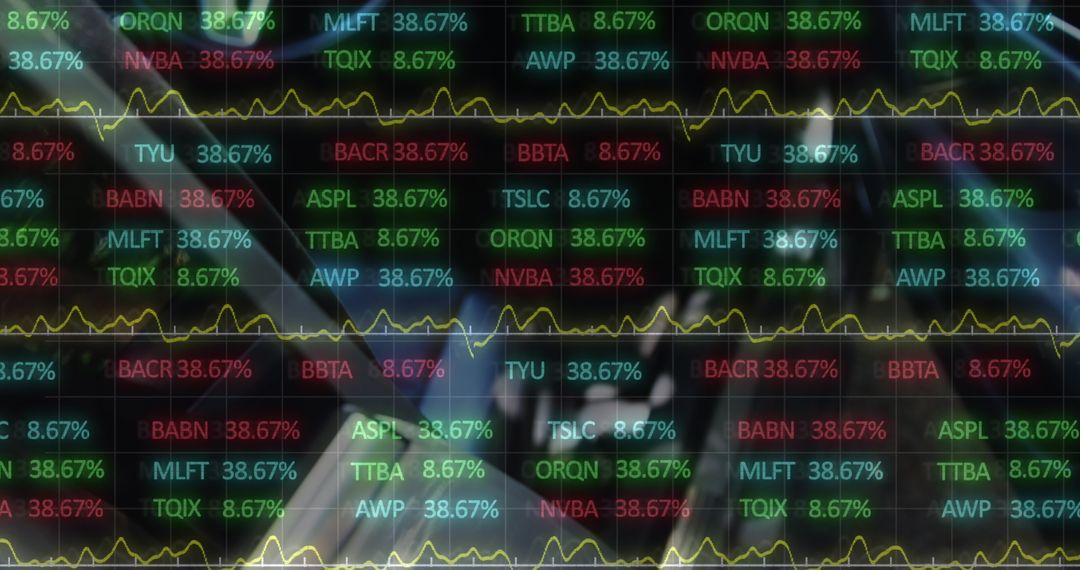
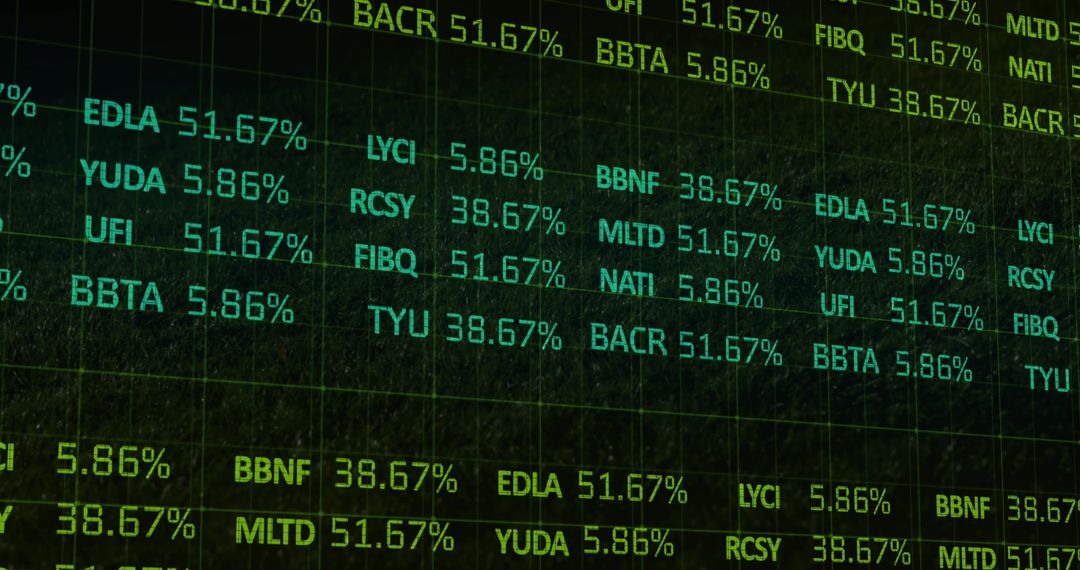
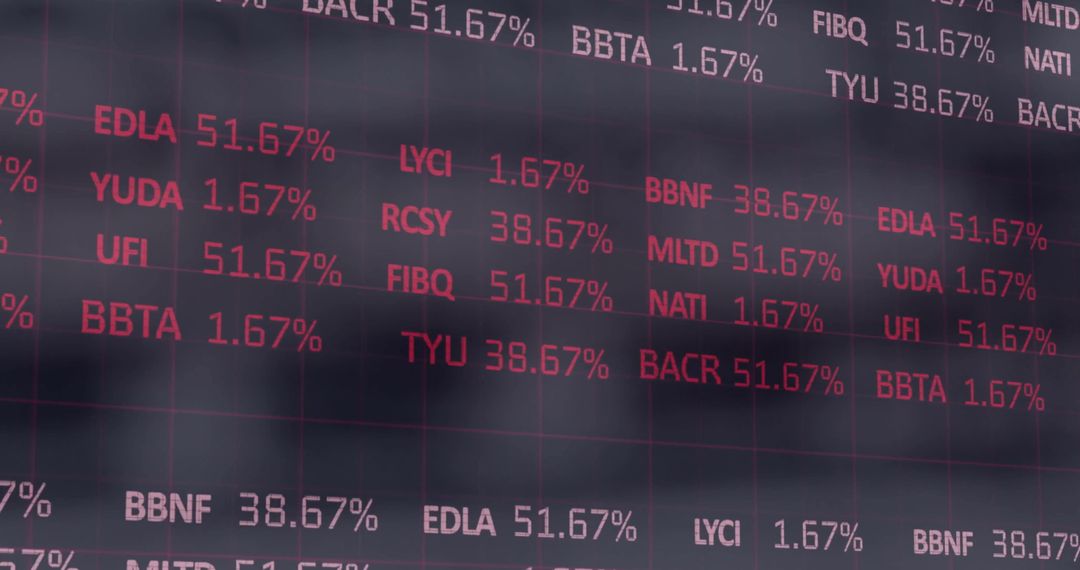
- Streaming neon stock tickers across glossy data tubes on dark grid dashboard
Streaming neon stock tickers across glossy data tubes on dark grid dashboard Image

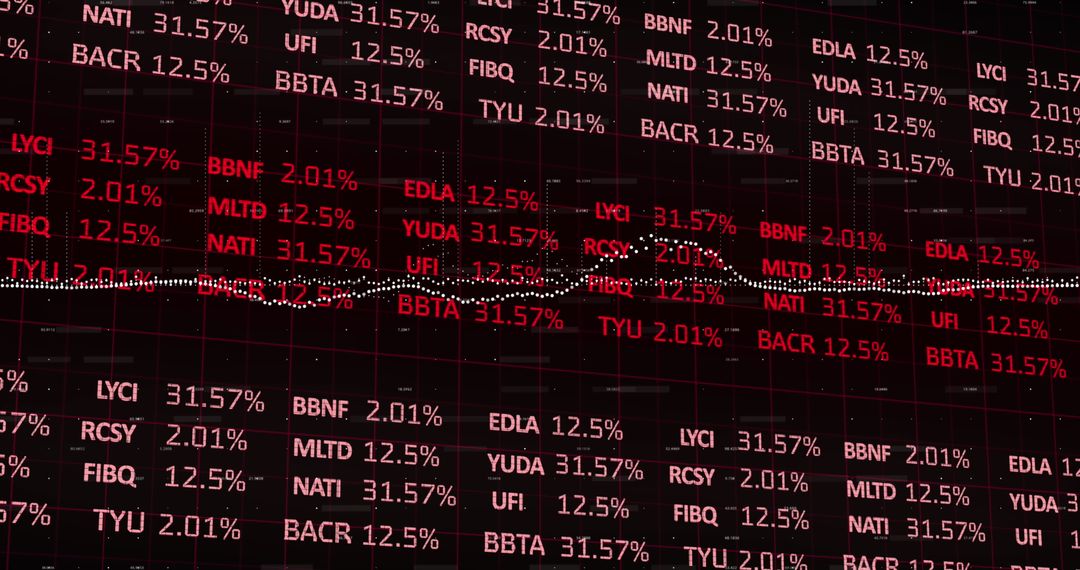
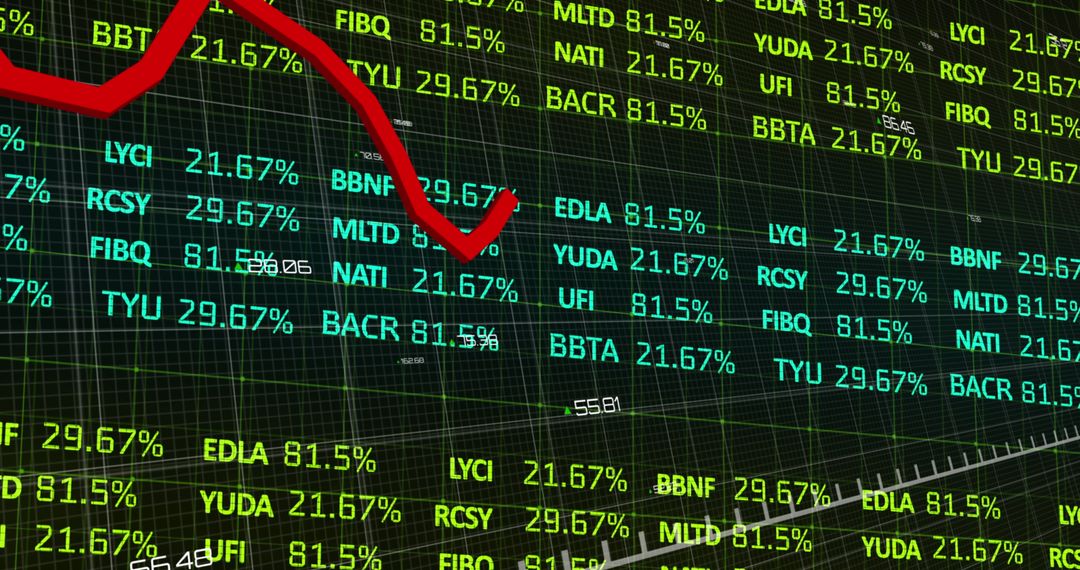
Showing neon green and cyan stock tickers and percentages layered over dark grid and glossy curved tubes, creating futuristic financial analytics mood. Featuring repeating alphanumeric tickers, bold percentage figures, reflective surfaces, strong diagonal motion and high-contrast neon palette. Suiting fintech landing pages, trading platform dashboards, financial reports, market commentary, blog headers, social media ads and conference visuals. Illustrating market volatility, data-driven trading, algorithmic analytics, digital transformation of finance. Offering ample left-aligned negative space for headline text and call-to-action overlays. Recommending crops for banner and hero formats, adding semi-transparent overlay for legibility, pairing with bold sans-serif typography and neon-accent color scheme.
Powered by  - Get 15% off with code: PIKWIZARD15


0
downloads
downloads
Tags:
More
Credit Photo
If you would like to credit the Photo, here are some ways you can do so
Text Link
photo Link
<span class="text-link">
<span>
<a target="_blank" href=https://pikwizard.com/photo/streaming-neon-stock-tickers-across-glossy-data-tubes-on-dark-grid-dashboard/9ddbce826028019c6fc6a763572b3a41/>PikWizard</a>
</span>
</span>
<span class="image-link">
<span
style="margin: 0 0 20px 0; display: inline-block; vertical-align: middle; width: 100%;"
>
<a
target="_blank"
href="https://pikwizard.com/photo/streaming-neon-stock-tickers-across-glossy-data-tubes-on-dark-grid-dashboard/9ddbce826028019c6fc6a763572b3a41/"
style="text-decoration: none; font-size: 10px; margin: 0;"
>
<img src="https://pikwizard.com/pw/medium/9ddbce826028019c6fc6a763572b3a41.jpg" style="margin: 0; width: 100%;" alt="" />
<p style="font-size: 12px; margin: 0;">PikWizard</p>
</a>
</span>
</span>
Free (free of charge)
Free for personal and commercial use.
Author: Awesome Content
Similar Free Stock Images

Premium


Premium


Premium


Premium


Premium


Premium


Premium


Premium


Premium


Premium


Premium


Premium


Premium


Premium


Premium


Premium


Premium


Premium


Premium


Premium


Premium


Premium


Premium


Premium