
- Home >
- Stock Photos >
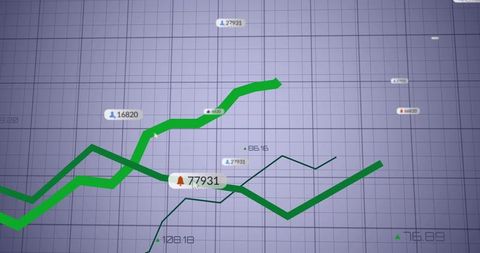
- Stylized Dashboard Displaying Colored Data Analytics Line Graphs
Stylized Dashboard Displaying Colored Data Analytics Line Graphs Image

Graphically represents data analytics with interconnected line graphs and numerical data markers. Useful for business intelligence presentations, illustrating trends and market analysis. Suitable for marketing professionals and data analysts.
Powered by 


downloads
Tags:
More
Credit Photo
If you would like to credit the Photo, here are some ways you can do so
Text Link
photo Link
<span class="text-link">
<span>
<a target="_blank" href=https://pikwizard.com/photo/stylized-dashboard-displaying-colored-data-analytics-line-graphs/f9fc66f4b0fca2e40613c1cefaa90d69/>PikWizard</a>
</span>
</span>
<span class="image-link">
<span
style="margin: 0 0 20px 0; display: inline-block; vertical-align: middle; width: 100%;"
>
<a
target="_blank"
href="https://pikwizard.com/photo/stylized-dashboard-displaying-colored-data-analytics-line-graphs/f9fc66f4b0fca2e40613c1cefaa90d69/"
style="text-decoration: none; font-size: 10px; margin: 0;"
>
<img src="https://pikwizard.com/pw/medium/f9fc66f4b0fca2e40613c1cefaa90d69.jpg" style="margin: 0; width: 100%;" alt="" />
<p style="font-size: 12px; margin: 0;">PikWizard</p>
</a>
</span>
</span>
Free (free of charge)
Free for personal and commercial use.
Author: Authentic Images
Similar Free Stock Images

Premium


Premium

Premium


Premium
Premium


Premium


Premium


Premium


Premium


Premium


Premium


Premium


Premium


Premium

Premium

Premium


Premium


Premium


Premium


Premium

Premium


Premium

Premium


Premium


Premium


Explore More Free Stock Images