
- Home >
- Stock Photos >
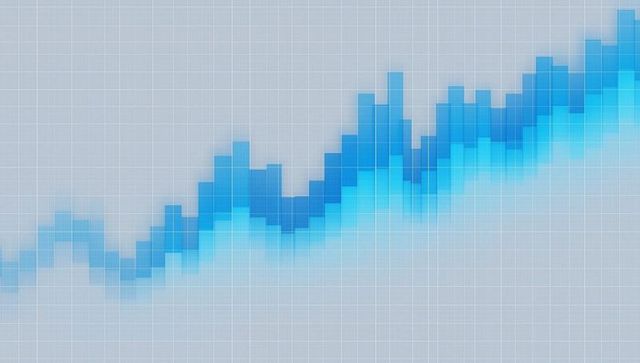
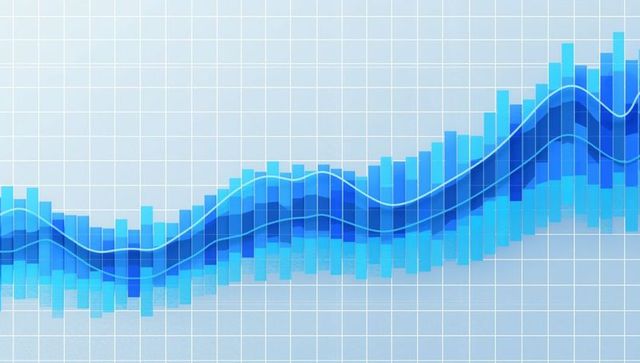
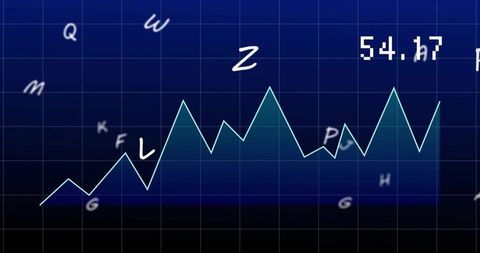
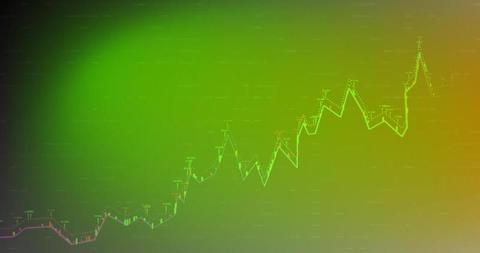
- Stylized Increasing Bar Chart on Light Grid Background
Stylized Increasing Bar Chart on Light Grid Background Image
AI
AI Generated Image. Digitally designed bar chart exhibits a gradual upward trajectory, depicting trend analysis in bright blue hues complemented by a light gray grid background. Used for illustrating business growth patterns, generating reports, and presentations in data analytics, finance, and investments. Ideal for depicting success and progress in future-oriented technological or economic projects.

downloads
Tags:
More
Credit Photo
If you would like to credit the Photo, here are some ways you can do so
Text Link
photo Link
<span class="text-link">
<span>
<a target="_blank" href=https://pikwizard.com/photo/stylized-increasing-bar-chart-on-light-grid-background/922c794aaee202cb7131f110e6ad6fd2/>PikWizard</a>
</span>
</span>
<span class="image-link">
<span
style="margin: 0 0 20px 0; display: inline-block; vertical-align: middle; width: 100%;"
>
<a
target="_blank"
href="https://pikwizard.com/photo/stylized-increasing-bar-chart-on-light-grid-background/922c794aaee202cb7131f110e6ad6fd2/"
style="text-decoration: none; font-size: 10px; margin: 0;"
>
<img src="https://pikwizard.com/pw/medium/922c794aaee202cb7131f110e6ad6fd2.jpg" style="margin: 0; width: 100%;" alt="" />
<p style="font-size: 12px; margin: 0;">PikWizard</p>
</a>
</span>
</span>
Free (free of charge)
Free for personal and commercial use.
Author: AI Creator
Similar Free Stock Images


AI


AI


AI


AI


AI


Explore More Free Stock Images