- Home >
- Stock Photos >
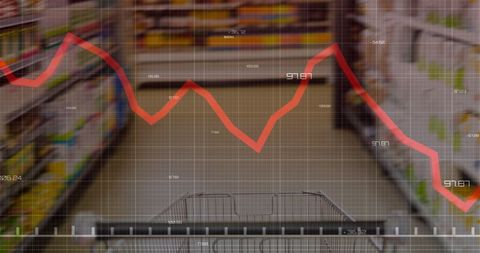
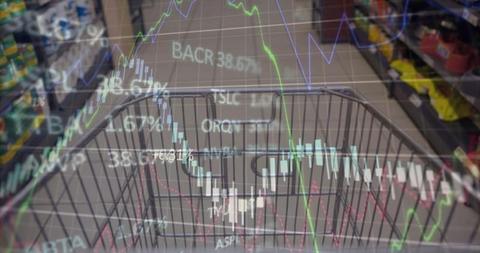
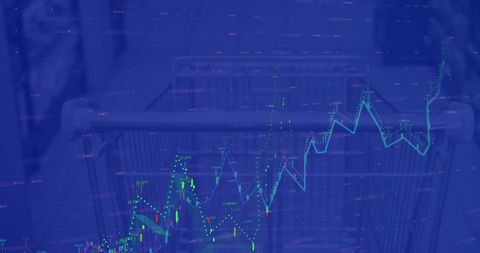
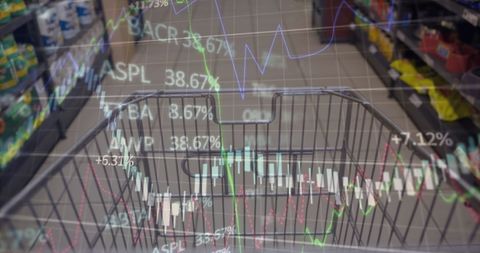
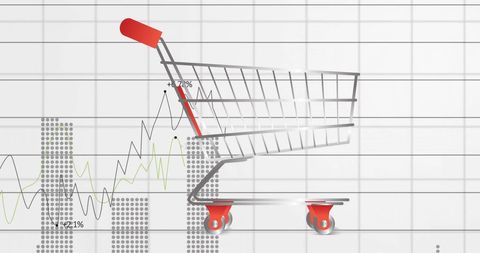
- Superimposed Graph on Shopping Cart Symbolizing Market Trends
Superimposed Graph on Shopping Cart Symbolizing Market Trends Image
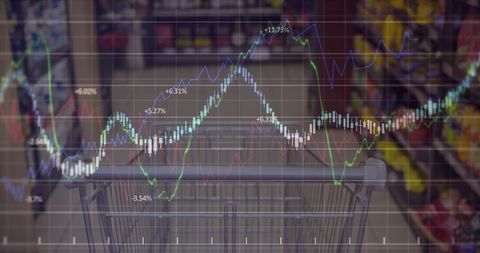
This visually compelling representation of market data superimposed over a shopping cart in a store aisle exemplifies the intersection of consumer behavior and financial strategies. The lines and numbers indicate fluctuations in market performance, making this an ideal visual for financial analysis, reports on consumer market trends, and discussions on retail economics. Useful for presentations, articles on business strategy, and educational purposes focused on market dynamics.
Powered by  - Get 15% off with code: PIKWIZARD15


2
downloads
downloads
Tags:
More
Credit Photo
If you would like to credit the Photo, here are some ways you can do so
Text Link
photo Link
<span class="text-link">
<span>
<a target="_blank" href=https://pikwizard.com/photo/superimposed-graph-on-shopping-cart-symbolizing-market-trends/1b8023a85620bab49be64189ca8472a8/>PikWizard</a>
</span>
</span>
<span class="image-link">
<span
style="margin: 0 0 20px 0; display: inline-block; vertical-align: middle; width: 100%;"
>
<a
target="_blank"
href="https://pikwizard.com/photo/superimposed-graph-on-shopping-cart-symbolizing-market-trends/1b8023a85620bab49be64189ca8472a8/"
style="text-decoration: none; font-size: 10px; margin: 0;"
>
<img src="https://pikwizard.com/pw/medium/1b8023a85620bab49be64189ca8472a8.jpg" style="margin: 0; width: 100%;" alt="" />
<p style="font-size: 12px; margin: 0;">PikWizard</p>
</a>
</span>
</span>
Free (free of charge)
Free for personal and commercial use.
Author: Creative Art