
- Home >
- Stock Photos >
- Sustainability and Technology in Data Visualization
Sustainability and Technology in Data Visualization Image
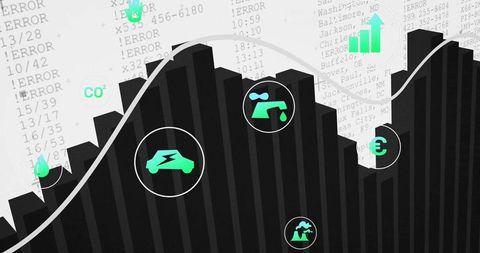
Bar chart shown with infusion of green technology and sustainability icons highlighting relevance to modern environmental topics. Useful for presentations on sustainability services, articles discussing environmental data trends, or educational content explaining how technology impacts data analysis practices.
Powered by 


downloads
Tags:
More
Credit Photo
If you would like to credit the Photo, here are some ways you can do so
Text Link
photo Link
<span class="text-link">
<span>
<a target="_blank" href=https://pikwizard.com/photo/sustainability-and-technology-in-data-visualization/f82d84749528ad81ea04e14a0a4db1a9/>PikWizard</a>
</span>
</span>
<span class="image-link">
<span
style="margin: 0 0 20px 0; display: inline-block; vertical-align: middle; width: 100%;"
>
<a
target="_blank"
href="https://pikwizard.com/photo/sustainability-and-technology-in-data-visualization/f82d84749528ad81ea04e14a0a4db1a9/"
style="text-decoration: none; font-size: 10px; margin: 0;"
>
<img src="https://pikwizard.com/pw/medium/f82d84749528ad81ea04e14a0a4db1a9.jpg" style="margin: 0; width: 100%;" alt="" />
<p style="font-size: 12px; margin: 0;">PikWizard</p>
</a>
</span>
</span>
Free (free of charge)
Free for personal and commercial use.
Author: Creative Art