- Home >
- Stock Photos >
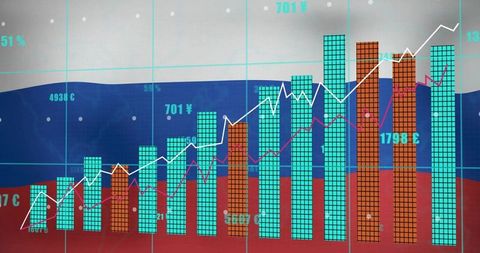
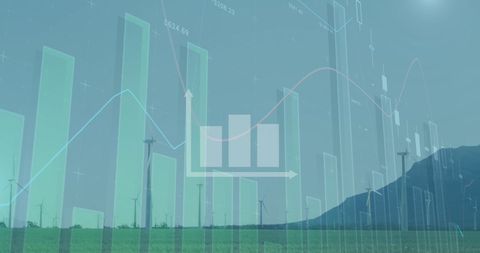
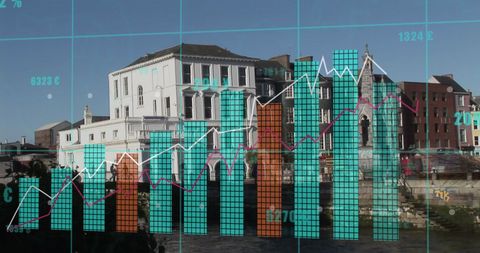
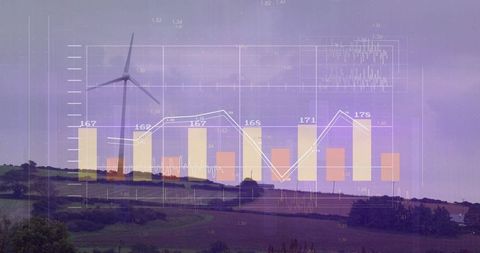
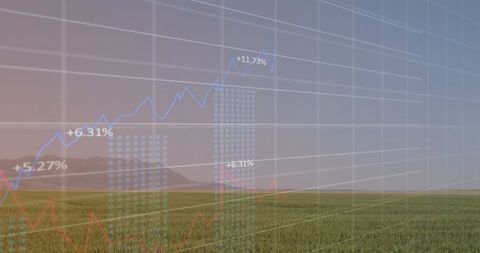
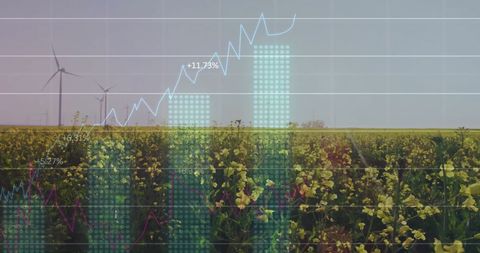
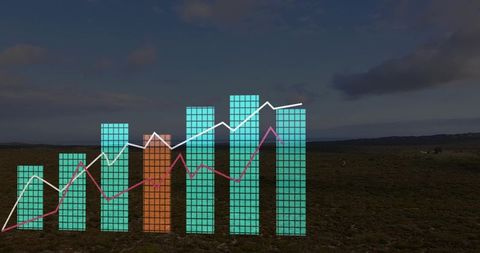
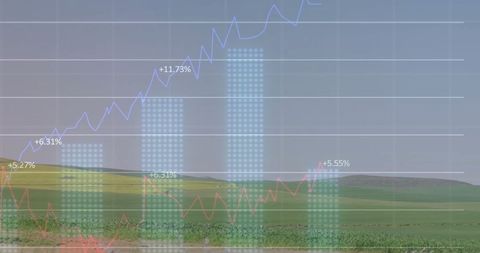
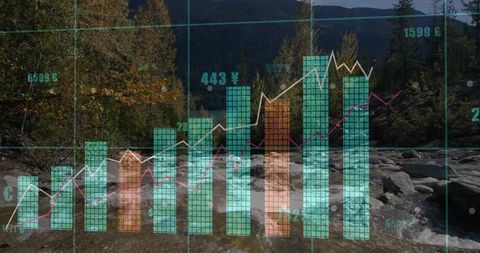
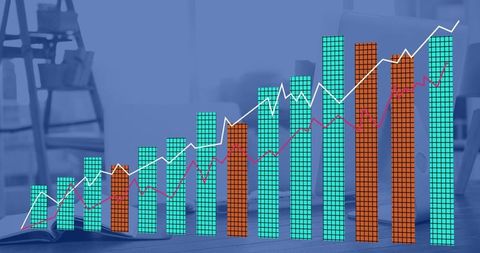
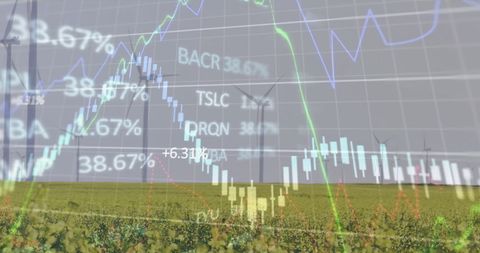
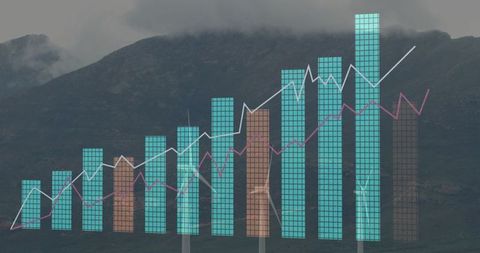
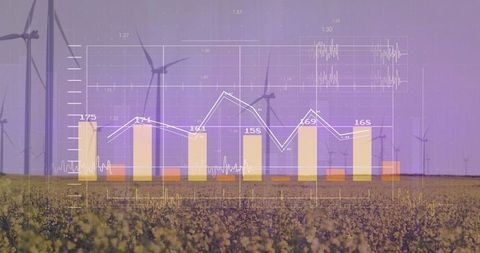
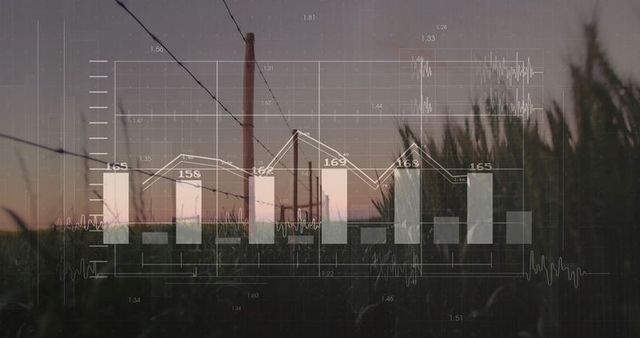
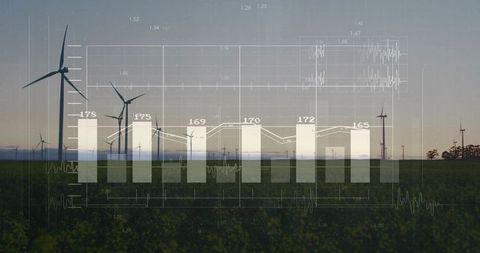
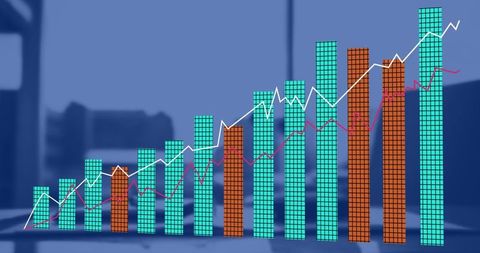
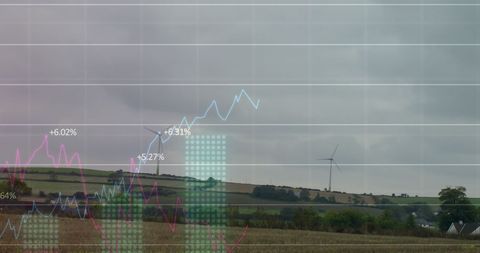
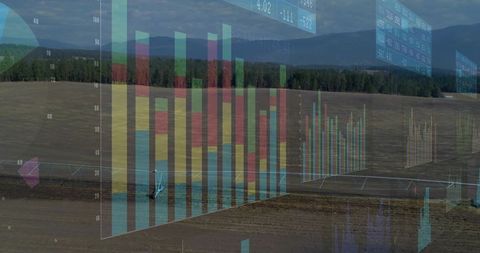
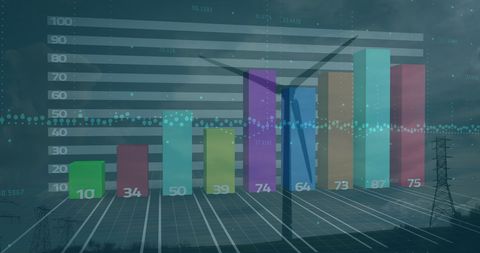
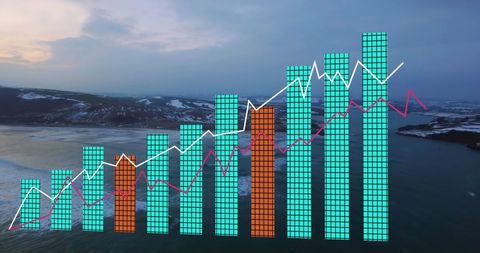
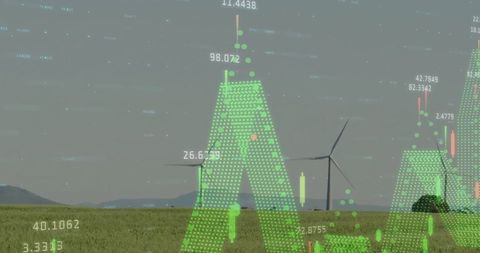
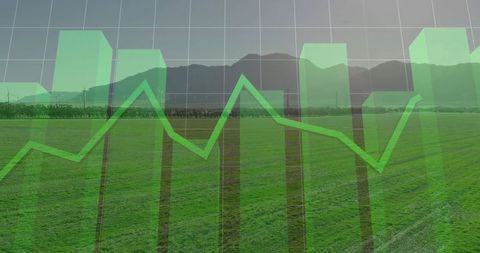
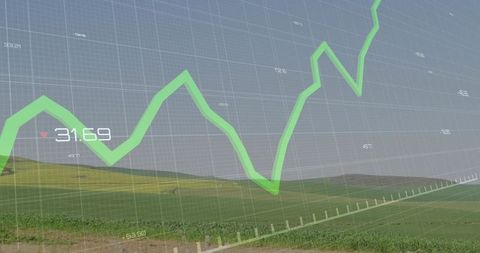
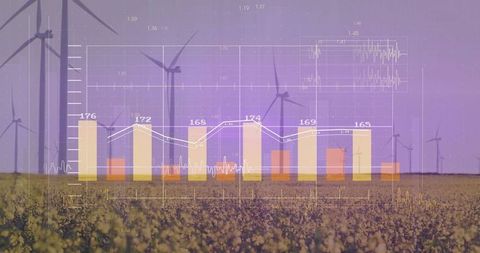
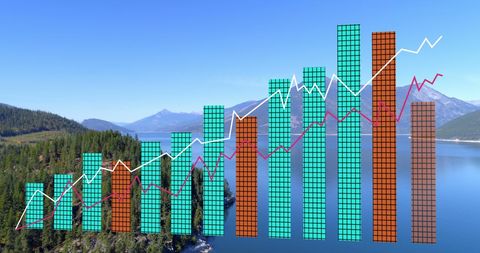
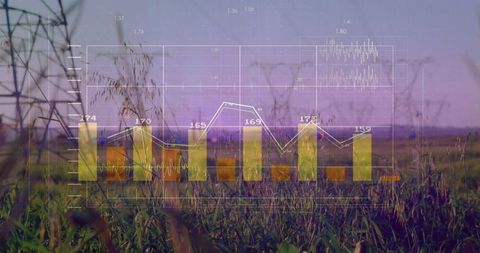
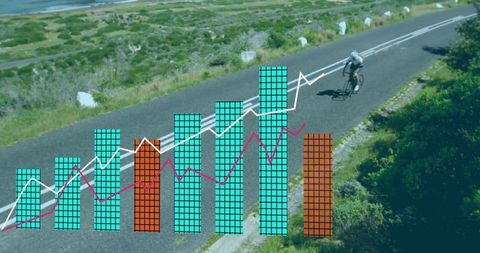
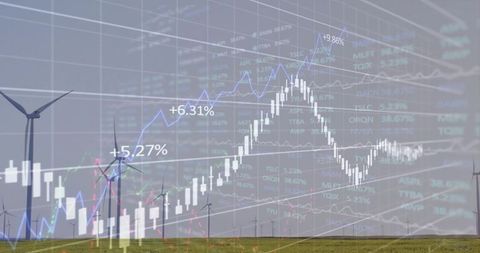
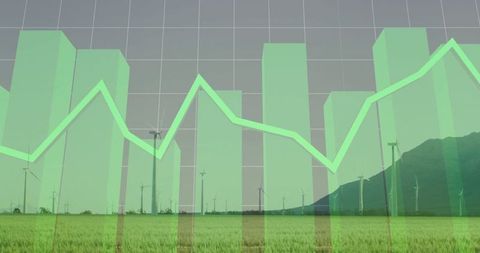
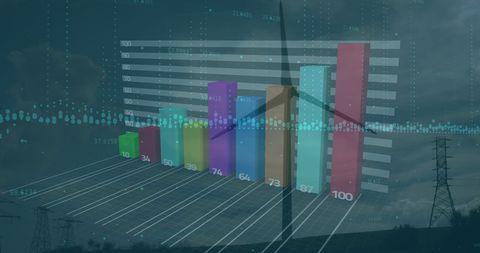
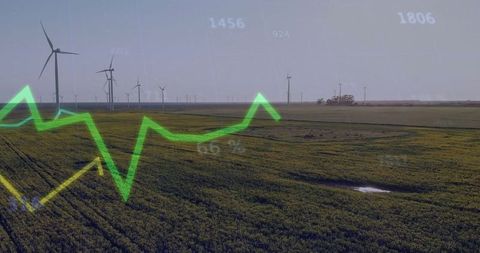
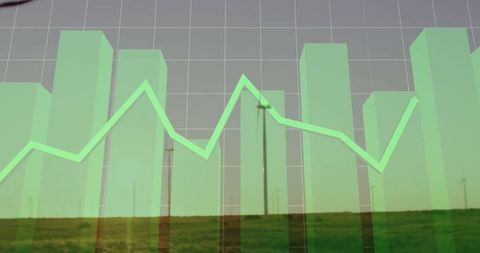
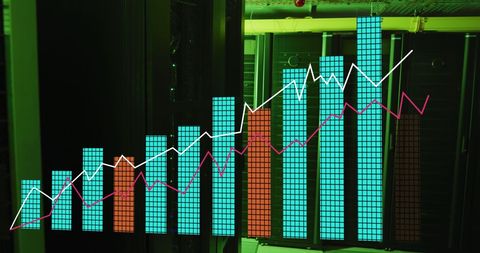
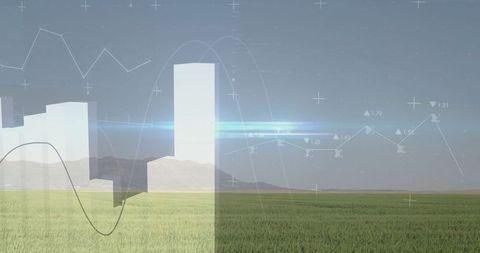
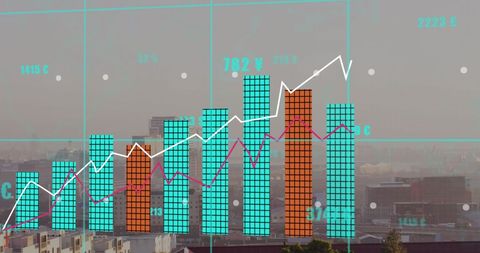
- Sustainable Agriculture Data Analytics Growth Chart Concept
Sustainable Agriculture Data Analytics Growth Chart Concept Image
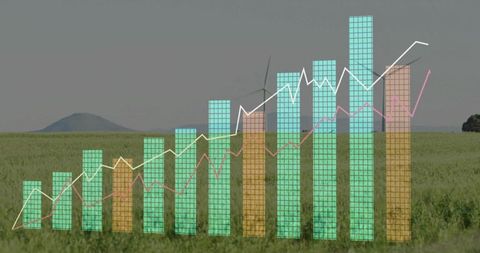
This visualization creatively combines data analytics with a powerful message about sustainable agriculture and renewable energy. Transparent bar charts displayed against a green crop field with subtle wind turbine hints represent growth and innovative technology integration. Useful for presentations on sustainability trends, renewable farming techniques, or eco-friendly business strategies.

downloads
Tags:
More
Credit Photo
If you would like to credit the Photo, here are some ways you can do so
Text Link
photo Link
<span class="text-link">
<span>
<a target="_blank" href=https://pikwizard.com/photo/sustainable-agriculture-data-analytics-growth-chart-concept/ee4864c4796bfb6830dbf011fb4011ca/>PikWizard</a>
</span>
</span>
<span class="image-link">
<span
style="margin: 0 0 20px 0; display: inline-block; vertical-align: middle; width: 100%;"
>
<a
target="_blank"
href="https://pikwizard.com/photo/sustainable-agriculture-data-analytics-growth-chart-concept/ee4864c4796bfb6830dbf011fb4011ca/"
style="text-decoration: none; font-size: 10px; margin: 0;"
>
<img src="https://pikwizard.com/pw/medium/ee4864c4796bfb6830dbf011fb4011ca.jpg" style="margin: 0; width: 100%;" alt="" />
<p style="font-size: 12px; margin: 0;">PikWizard</p>
</a>
</span>
</span>
Free (free of charge)
Free for personal and commercial use.
Author: People Creations