- Home >
- Stock Photos >
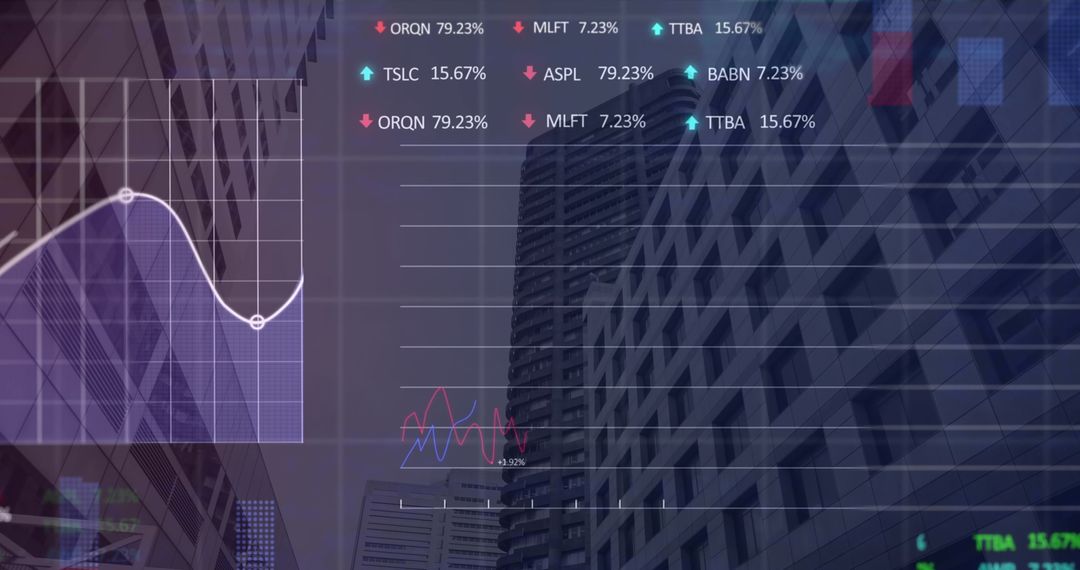
- Sustainable Icons Overlay on Financial Data Analysis Concept
Sustainable Icons Overlay on Financial Data Analysis Concept Image

Visual depicting engagement in eco-friendly investments, showcasing eco-icons like renewable energy and recycling overlaid on financial data. Perfect for illustrating sustainable finance, analyzing economic impact on environmental initiatives, or presenting technology-driven solutions for eco development in corporate reports and presentations.
Powered by 


6
downloads
downloads
Tags:
More
Credit Photo
If you would like to credit the Photo, here are some ways you can do so
Text Link
photo Link
<span class="text-link">
<span>
<a target="_blank" href=https://pikwizard.com/photo/sustainable-icons-overlay-on-financial-data-analysis-concept/d993441c3e095e9b85340306c9baf3d5/>PikWizard</a>
</span>
</span>
<span class="image-link">
<span
style="margin: 0 0 20px 0; display: inline-block; vertical-align: middle; width: 100%;"
>
<a
target="_blank"
href="https://pikwizard.com/photo/sustainable-icons-overlay-on-financial-data-analysis-concept/d993441c3e095e9b85340306c9baf3d5/"
style="text-decoration: none; font-size: 10px; margin: 0;"
>
<img src="https://pikwizard.com/pw/medium/d993441c3e095e9b85340306c9baf3d5.jpg" style="margin: 0; width: 100%;" alt="" />
<p style="font-size: 12px; margin: 0;">PikWizard</p>
</a>
</span>
</span>
Free (free of charge)
Free for personal and commercial use.
Author: Awesome Content
Similar Free Stock Images

Premium


Premium


Premium


Premium


Premium


Premium


Premium


Premium


Premium


Premium


Premium


Premium


Premium


Premium


Premium


Premium


Premium


Premium


Premium


Premium


Premium


Premium


Premium


Premium