
- Home >
- Stock Photos >
- Sustainable Technology and Finance Data Interface Visualization
Sustainable Technology and Finance Data Interface Visualization Image
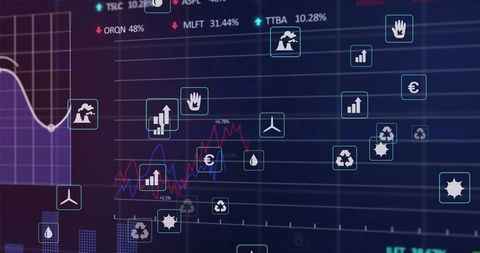
Displaying a dynamic dashboard visualizing analytics relating to technology and finance with icons of a factory and wind turbine symbolizing sustainability and innovation. Helpful for illustrating concepts in tech finance and optimizing resource management. Can be used in presentations or articles focusing on data analytics, growth, and ecological sustainability interfaces.
Powered by 


downloads
Tags:
More
Credit Photo
If you would like to credit the Photo, here are some ways you can do so
Text Link
photo Link
<span class="text-link">
<span>
<a target="_blank" href=https://pikwizard.com/photo/sustainable-technology-and-finance-data-interface-visualization/a6a495acb5f9841af7ce607b5fbc94d2/>PikWizard</a>
</span>
</span>
<span class="image-link">
<span
style="margin: 0 0 20px 0; display: inline-block; vertical-align: middle; width: 100%;"
>
<a
target="_blank"
href="https://pikwizard.com/photo/sustainable-technology-and-finance-data-interface-visualization/a6a495acb5f9841af7ce607b5fbc94d2/"
style="text-decoration: none; font-size: 10px; margin: 0;"
>
<img src="https://pikwizard.com/pw/medium/a6a495acb5f9841af7ce607b5fbc94d2.jpg" style="margin: 0; width: 100%;" alt="" />
<p style="font-size: 12px; margin: 0;">PikWizard</p>
</a>
</span>
</span>
Free (free of charge)
Free for personal and commercial use.
Author: People Creations