- Home >
- Stock Photos >
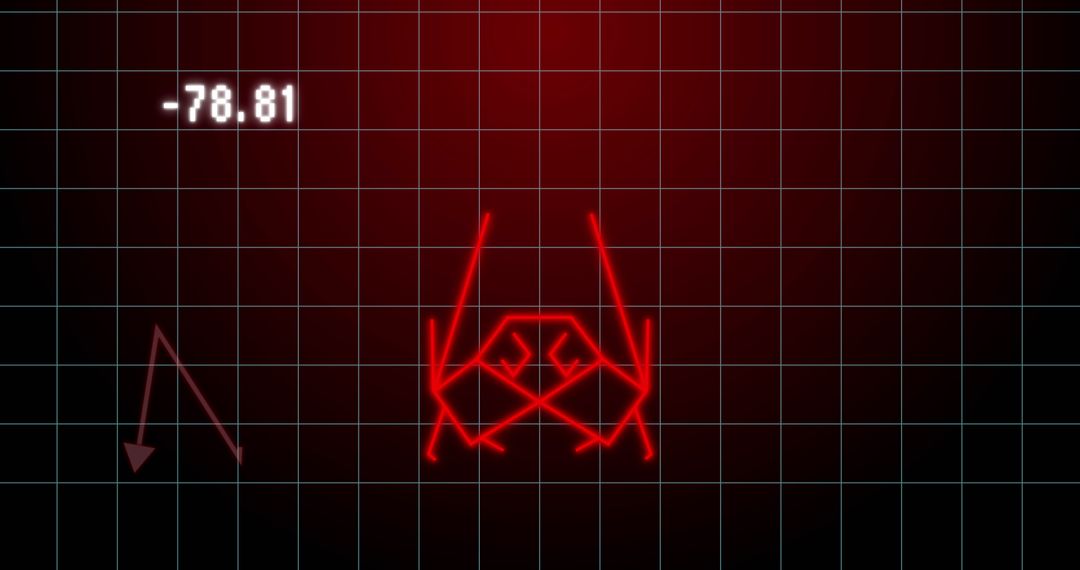
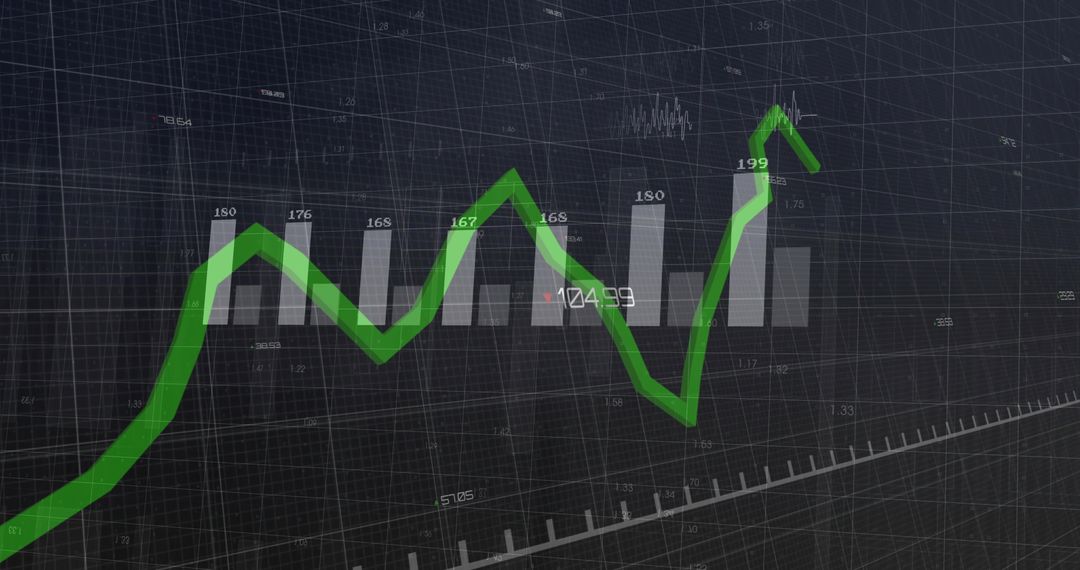
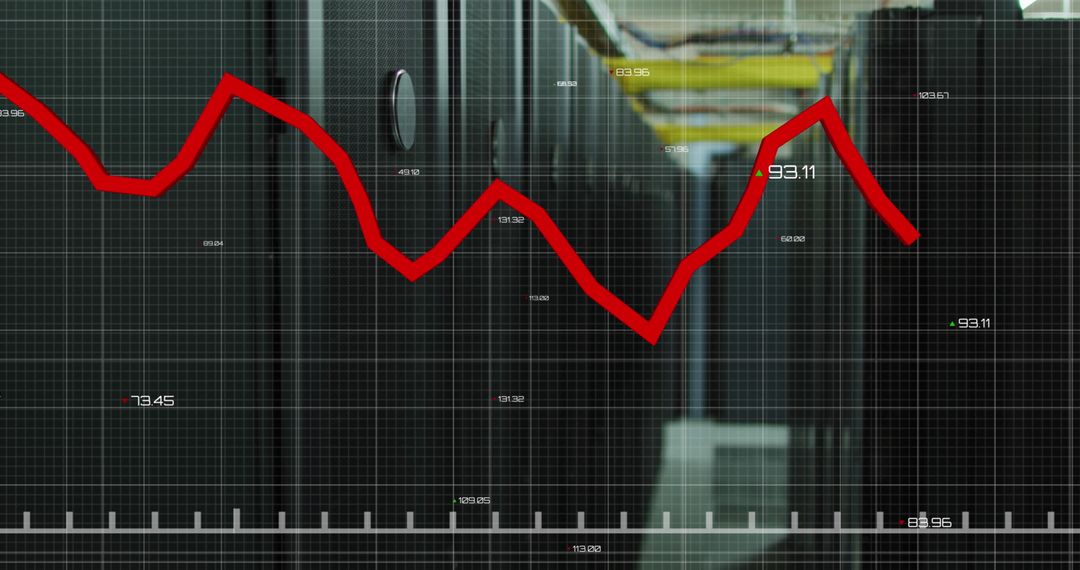
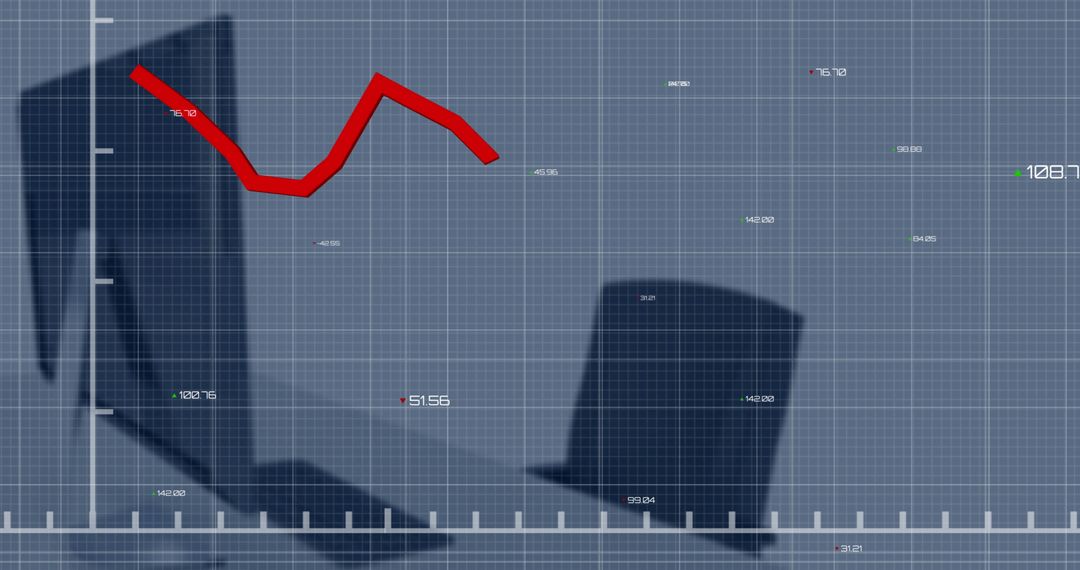
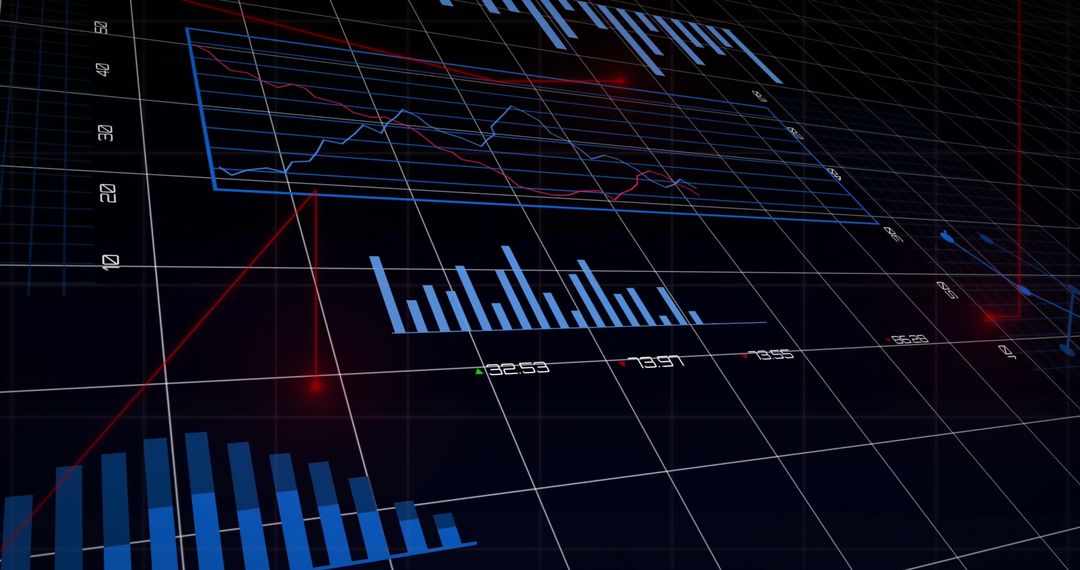
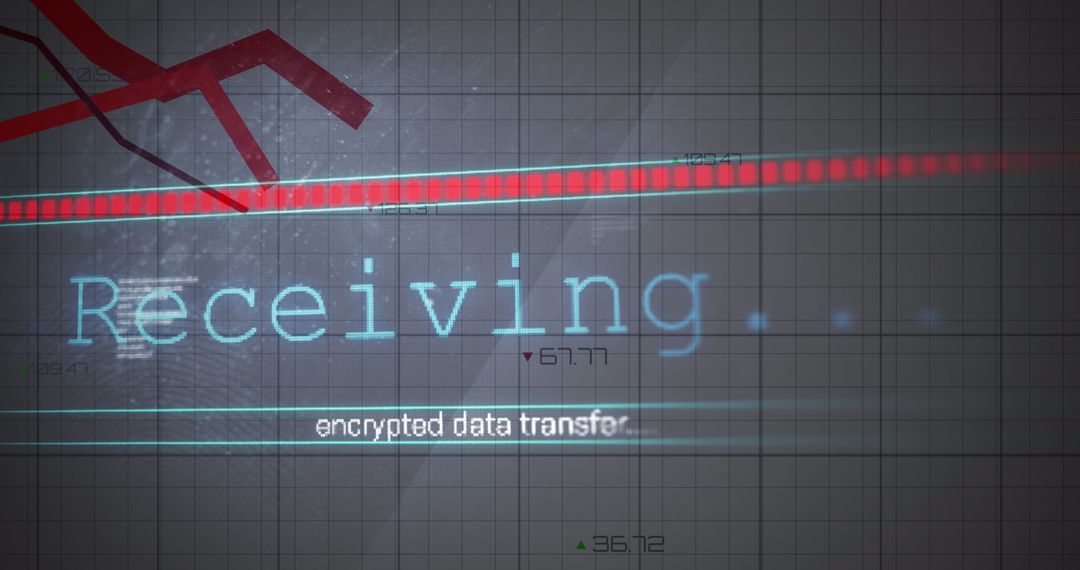
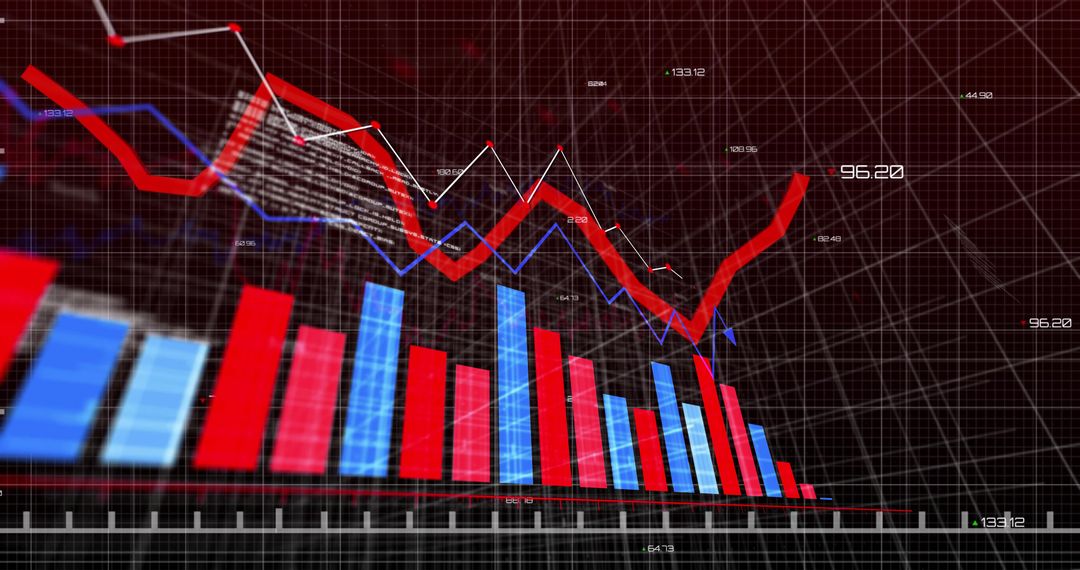
- Tablet displaying 3D bar chart with red arrow and jagged trend line on dark grid
Tablet displaying 3D bar chart with red arrow and jagged trend line on dark grid Image

Dark grid background featuring tablet displaying 3D bar chart with red arrow and jagged trend line, conveying market volatility and data-driven analysis. Visual portraying falling values with partial rebound, suggesting risk and opportunity for trading and investment communications. Ideal for financial presentations, market commentary, business reports, trading platform interfaces, economic forecasts. Use for website banners, blog headers, press releases, social media posts, investor briefings, annual reports, training materials. Color palette and dramatic red accent aiding emphasis on decline, recovery, trend shifts. Modern digital aesthetic suiting editorial and commercial projects looking for technology-driven financial visuals.
Powered by  - Get 15% off with code: PIKWIZARD15


0
downloads
downloads
Tags:
More
Credit Photo
If you would like to credit the Photo, here are some ways you can do so
Text Link
photo Link
<span class="text-link">
<span>
<a target="_blank" href=https://pikwizard.com/photo/tablet-displaying-3d-bar-chart-with-red-arrow-and-jagged-trend-line-on-dark-grid/82de06f1f293fee511c0e9bad5516741/>PikWizard</a>
</span>
</span>
<span class="image-link">
<span
style="margin: 0 0 20px 0; display: inline-block; vertical-align: middle; width: 100%;"
>
<a
target="_blank"
href="https://pikwizard.com/photo/tablet-displaying-3d-bar-chart-with-red-arrow-and-jagged-trend-line-on-dark-grid/82de06f1f293fee511c0e9bad5516741/"
style="text-decoration: none; font-size: 10px; margin: 0;"
>
<img src="https://pikwizard.com/pw/medium/82de06f1f293fee511c0e9bad5516741.jpg" style="margin: 0; width: 100%;" alt="" />
<p style="font-size: 12px; margin: 0;">PikWizard</p>
</a>
</span>
</span>
Free (free of charge)
Free for personal and commercial use.
Author: Awesome Content
Similar Free Stock Images

Premium


Premium


Premium


Premium


Premium


Premium


Premium


Premium


Premium


Premium


Premium


Premium


Premium


Premium


Premium


Premium


Premium


Premium


Premium


Premium


Premium


Premium


Premium


Premium