
- Home >
- Stock Photos >
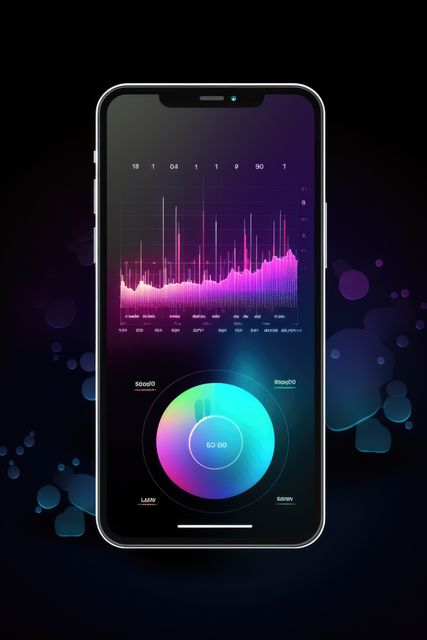
- Tablet Displaying Analytics Chart with Virtual Interface
Tablet Displaying Analytics Chart with Virtual Interface Image

AI
AI Generated Image. Tablet showcasing a colorful bar graph and digital grid animations, suggesting themes of innovative data analysis and technological advancement. Perfect for use in presentations, articles about data science, or promoting tech solutions in statistics and business intelligence.

downloads
Tags:
More
Credit Photo
If you would like to credit the Photo, here are some ways you can do so
Text Link
photo Link
<span class="text-link">
<span>
<a target="_blank" href=https://pikwizard.com/photo/tablet-displaying-analytics-chart-with-virtual-interface/41f8456b77e705a8db37713fa737096f/>PikWizard</a>
</span>
</span>
<span class="image-link">
<span
style="margin: 0 0 20px 0; display: inline-block; vertical-align: middle; width: 100%;"
>
<a
target="_blank"
href="https://pikwizard.com/photo/tablet-displaying-analytics-chart-with-virtual-interface/41f8456b77e705a8db37713fa737096f/"
style="text-decoration: none; font-size: 10px; margin: 0;"
>
<img src="https://pikwizard.com/pw/medium/41f8456b77e705a8db37713fa737096f.jpg" style="margin: 0; width: 100%;" alt="" />
<p style="font-size: 12px; margin: 0;">PikWizard</p>
</a>
</span>
</span>
Free (free of charge)
Free for personal and commercial use.
Author: AI Creator
Similar Free Stock Images


AI


AI


AI


AI


AI

AI


AI


AI


AI


AI

AI


AI


AI

AI


AI


AI

AI


AI

AI


AI

AI


AI


AI


AI


AI


AI

AI


AI

Explore More Free Stock Images