- Home >
- Stock Photos >
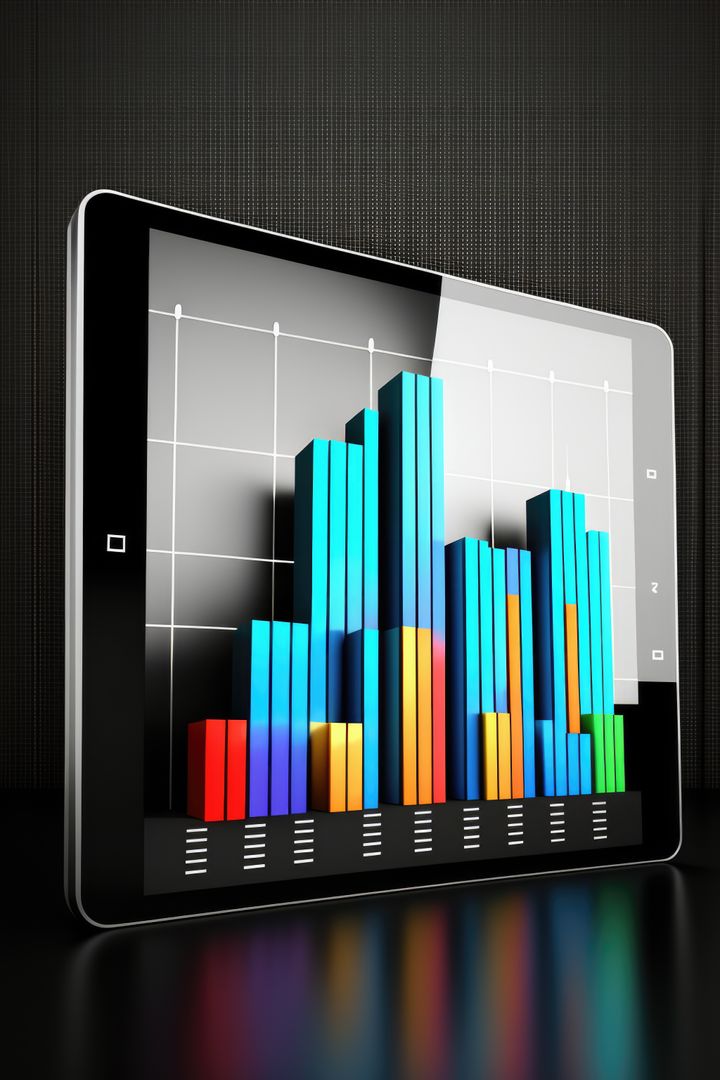
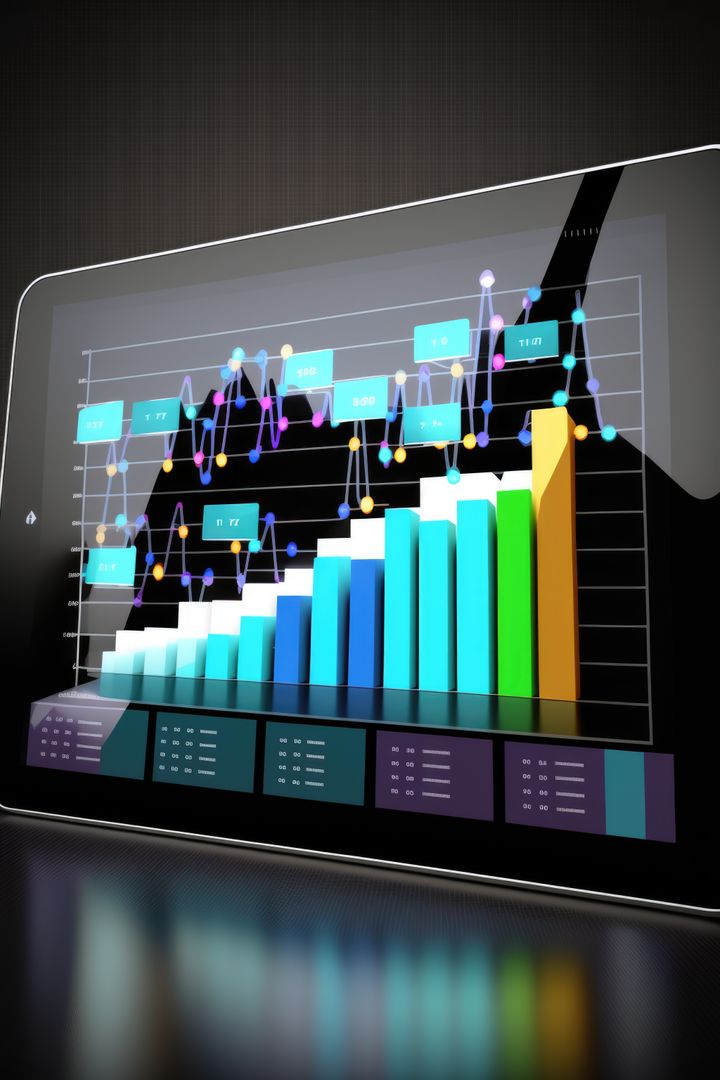
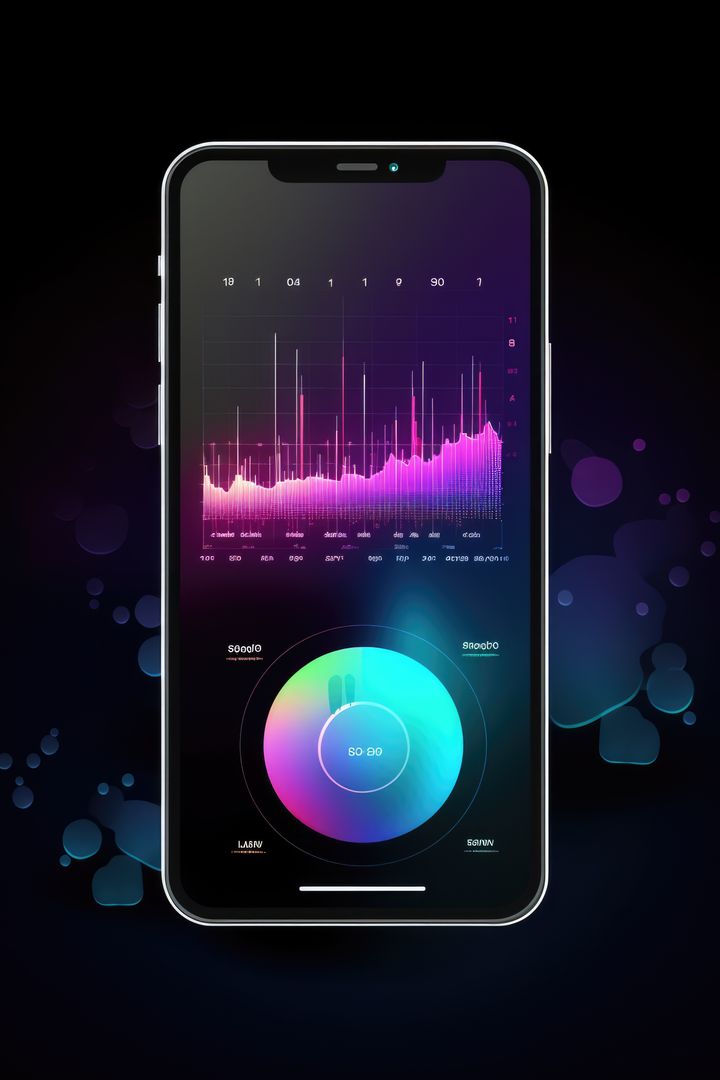
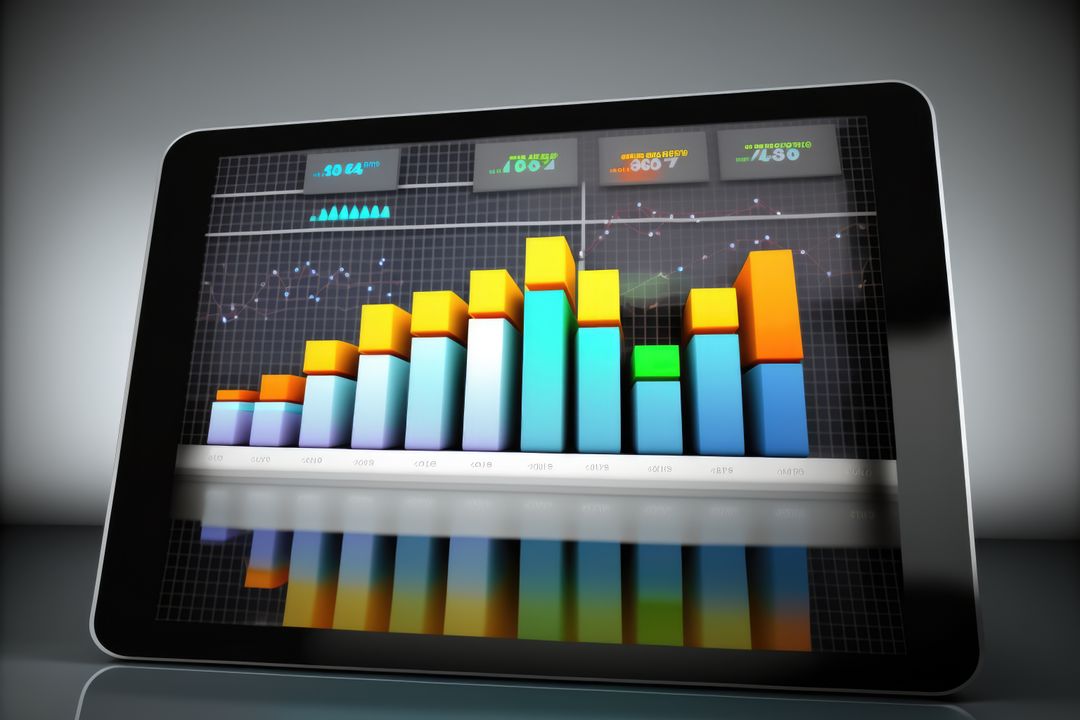
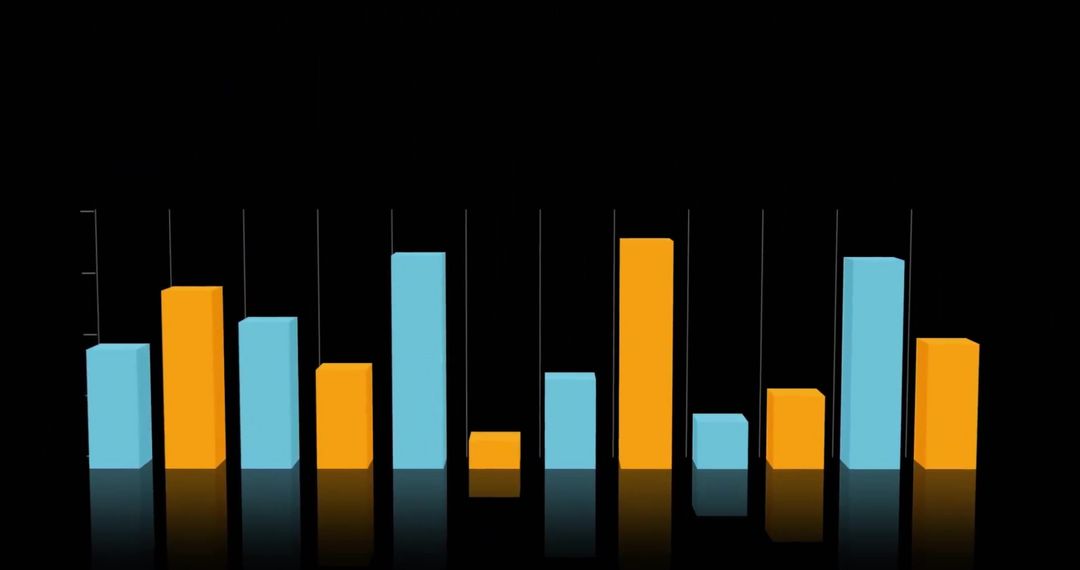
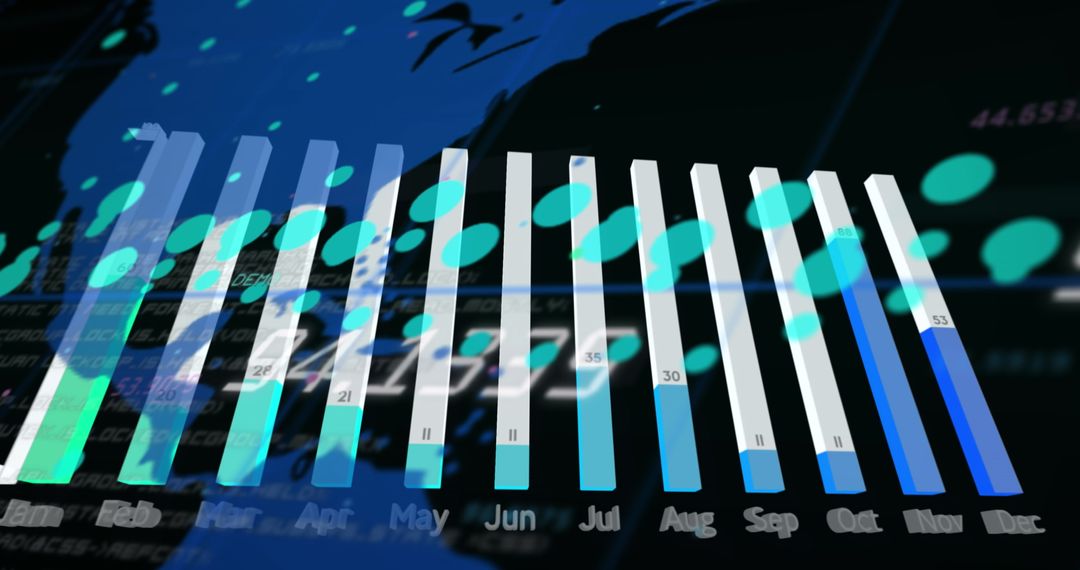
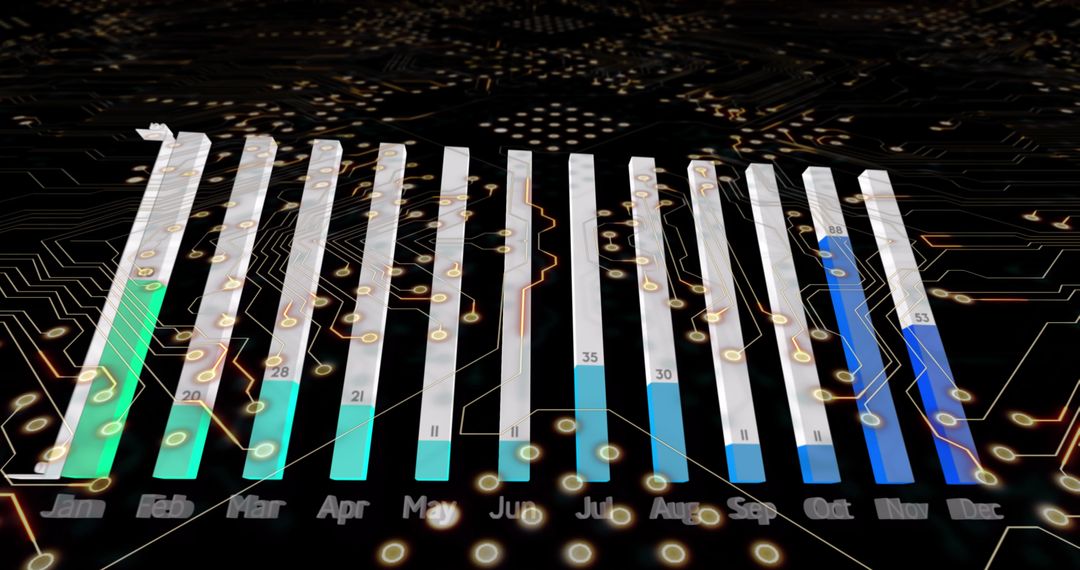
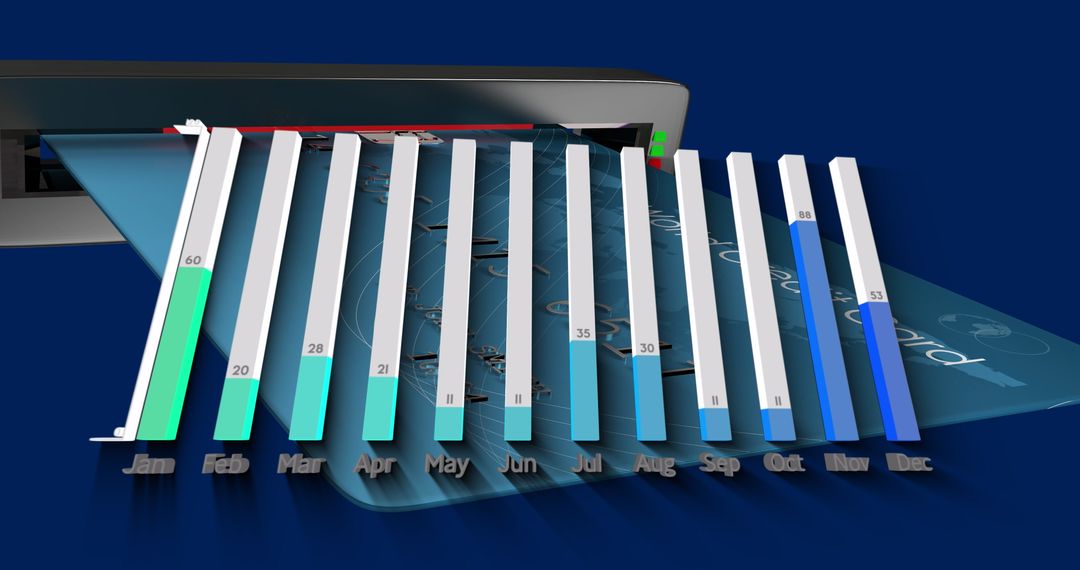
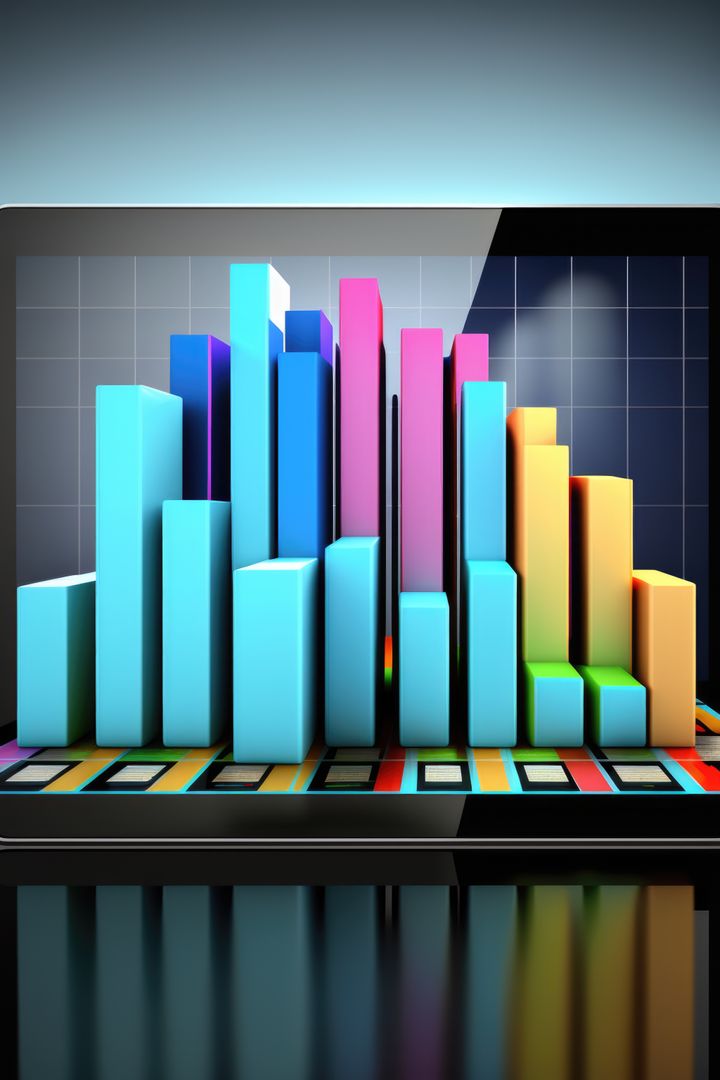
- Tablet Displaying Colorful Bar Graph and Great Chart Visualization
Tablet Displaying Colorful Bar Graph and Great Chart Visualization Image
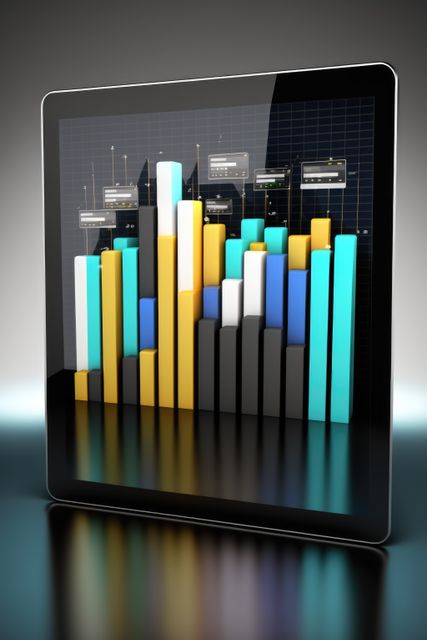
AI Generated Image. Colorful bar graphs are digitally rendered on a tablet screen, showcasing data analytics. Useful for articles on technology advancements, data reporting, or infographics about trends in digital business solutions. Ideal for illustrating topics related to statistics, modern decision making tools, or virtual reality's role in data management.
Powered by 


2
downloads
downloads
Tags:
More
Credit Photo
If you would like to credit the Photo, here are some ways you can do so
Text Link
photo Link
<span class="text-link">
<span>
<a target="_blank" href=https://pikwizard.com/photo/tablet-displaying-colorful-bar-graph-and-great-chart-visualization/ce73ab271435742cc6adce2cef2a4760/>PikWizard</a>
</span>
</span>
<span class="image-link">
<span
style="margin: 0 0 20px 0; display: inline-block; vertical-align: middle; width: 100%;"
>
<a
target="_blank"
href="https://pikwizard.com/photo/tablet-displaying-colorful-bar-graph-and-great-chart-visualization/ce73ab271435742cc6adce2cef2a4760/"
style="text-decoration: none; font-size: 10px; margin: 0;"
>
<img src="https://pikwizard.com/pw/medium/ce73ab271435742cc6adce2cef2a4760.jpg" style="margin: 0; width: 100%;" alt="" />
<p style="font-size: 12px; margin: 0;">PikWizard</p>
</a>
</span>
</span>
Free (free of charge)
Free for personal and commercial use.
Author: AI Creator
Similar Free Stock Images

Premium


Premium


Premium


Premium


Premium


Premium


Premium


Premium


Premium


Premium


Premium


Premium


Premium


Premium


Premium


Premium


Premium


Premium


Premium


Premium


Premium


Premium


Premium


Premium