- Home >
- Stock Photos >
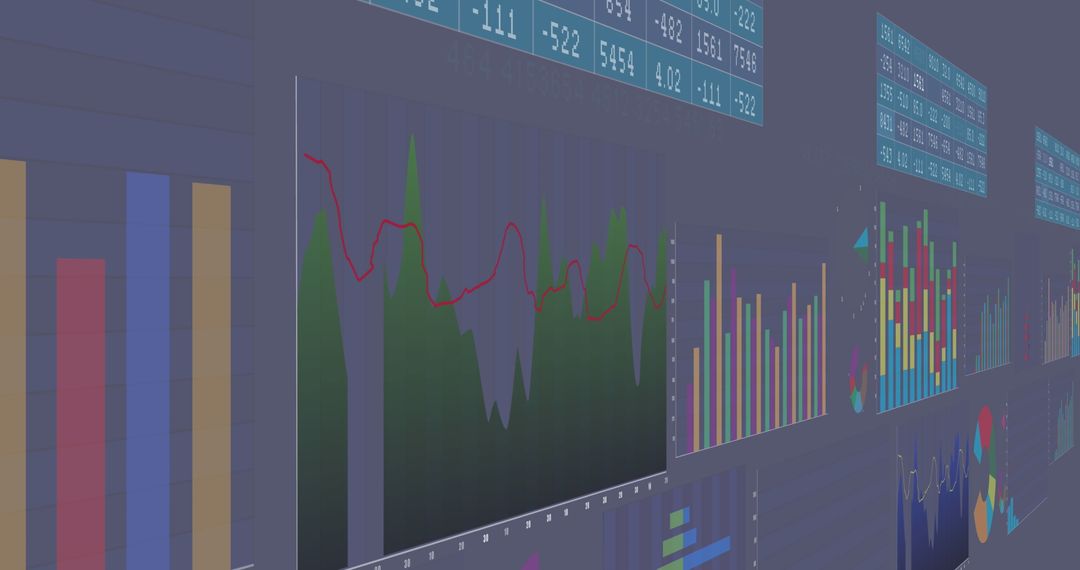
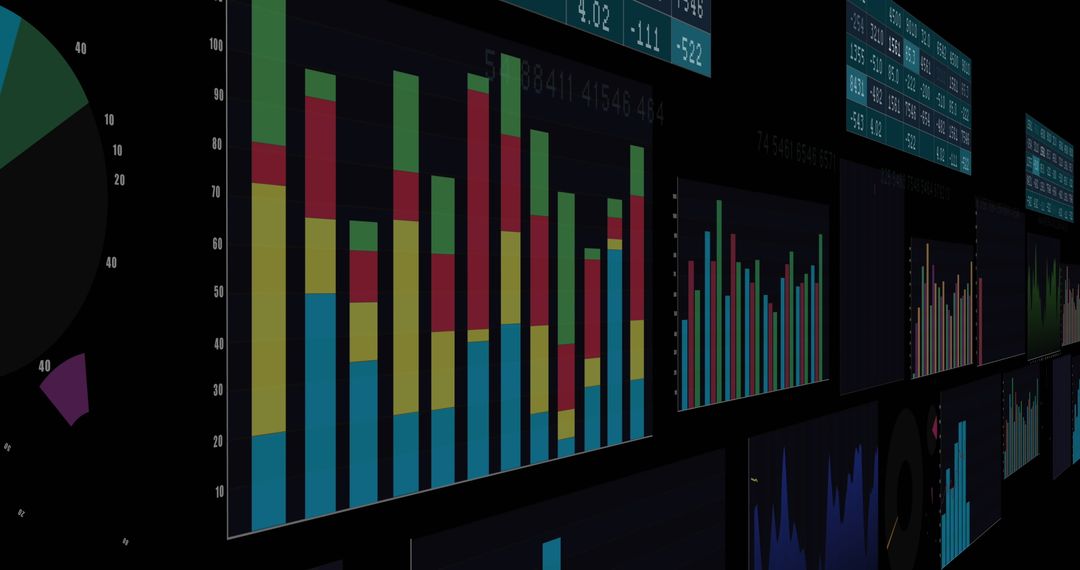
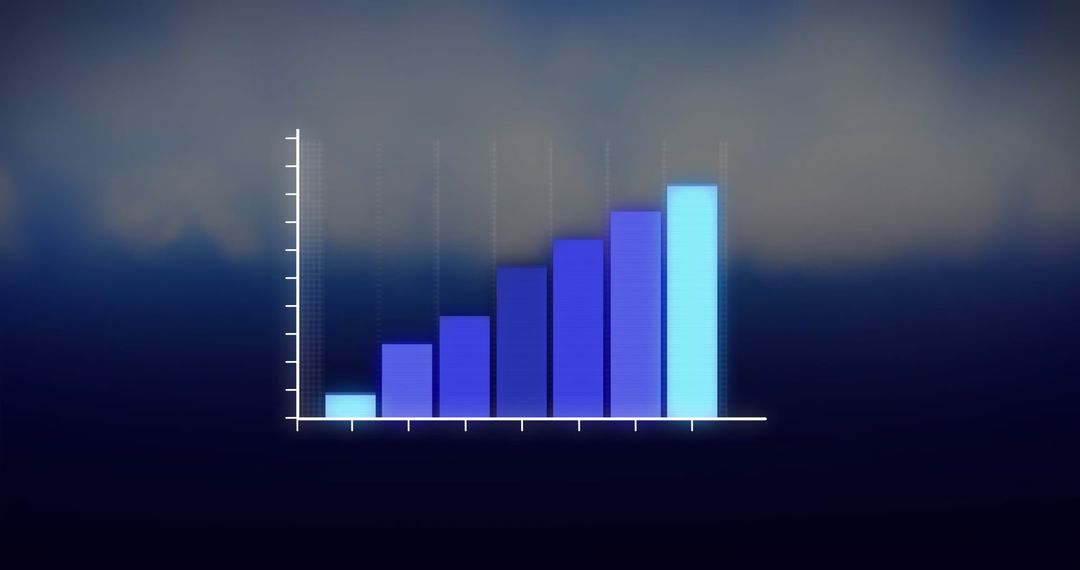
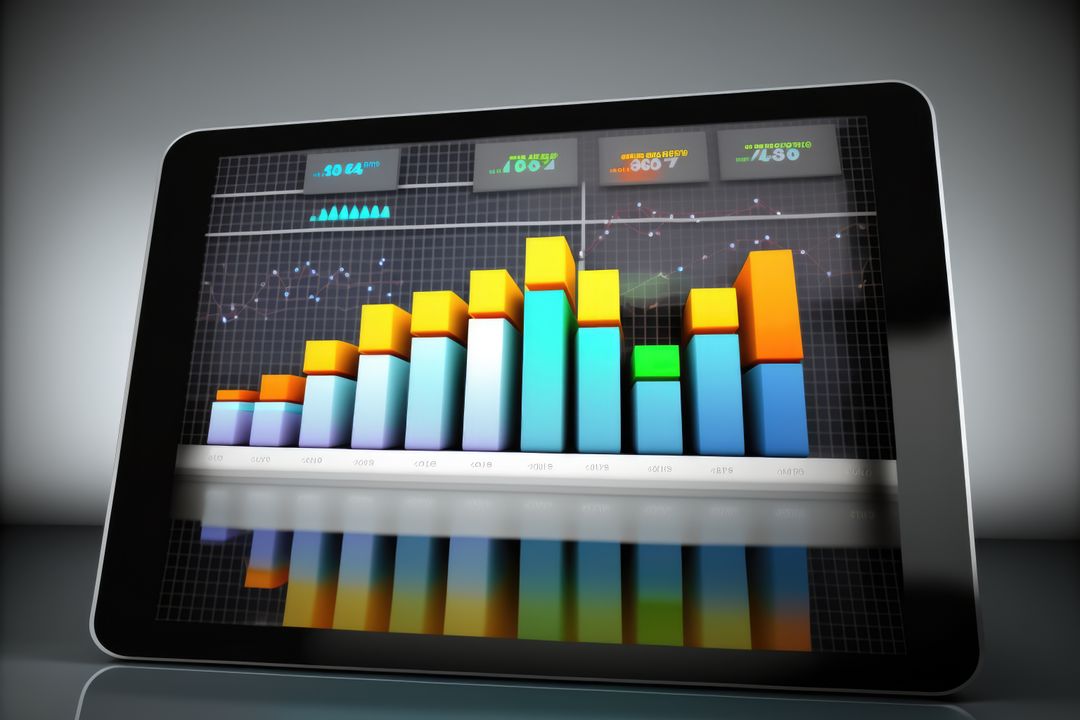
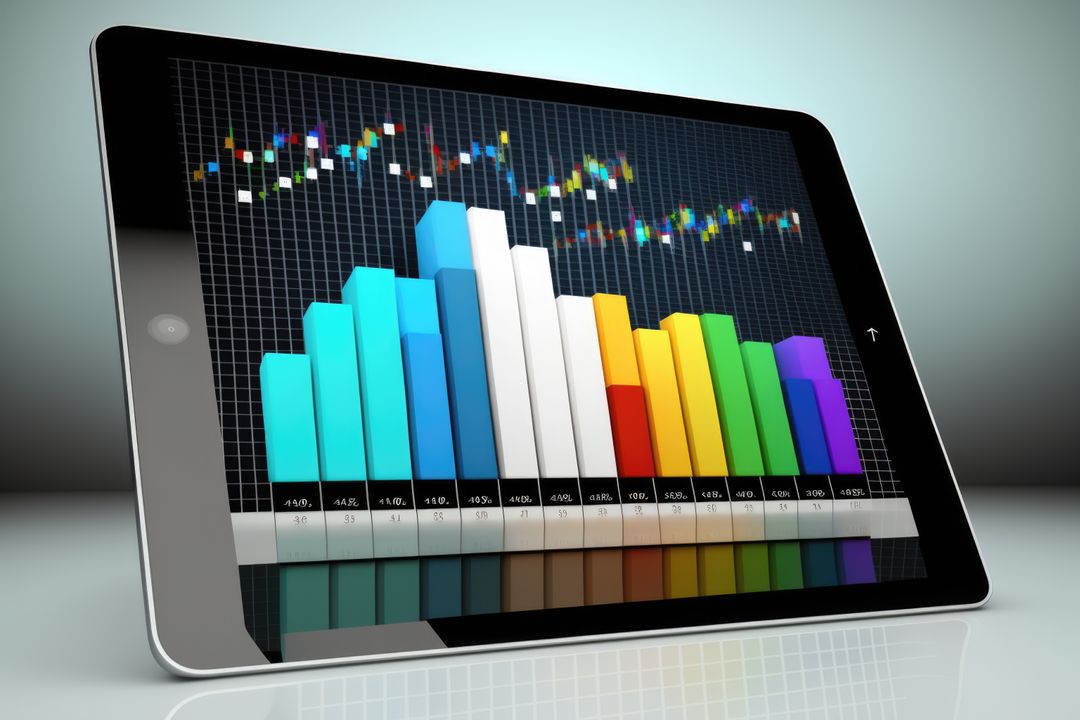
- Tablet Displaying Colorful Digital Graphs on Dark Background
Tablet Displaying Colorful Digital Graphs on Dark Background Image

AI Generated Image. A futuristic scene showing a tablet screen with colorful graphs and bar charts on a dark background. Ideal for illustrating concepts related to data analysis, business forecasting, statistical research, or the use of generative AI in digital technology. Useful for presentations, articles, and websites focusing on technology trends and data visualization.
Powered by  - Get 15% off with code: PIKWIZARD15


2
downloads
downloads
Tags:
More
Credit Photo
If you would like to credit the Photo, here are some ways you can do so
Text Link
photo Link
<span class="text-link">
<span>
<a target="_blank" href=https://pikwizard.com/photo/tablet-displaying-colorful-digital-graphs-on-dark-background/8d9098fb9e3a17a7d016102ee7f4fe7d/>PikWizard</a>
</span>
</span>
<span class="image-link">
<span
style="margin: 0 0 20px 0; display: inline-block; vertical-align: middle; width: 100%;"
>
<a
target="_blank"
href="https://pikwizard.com/photo/tablet-displaying-colorful-digital-graphs-on-dark-background/8d9098fb9e3a17a7d016102ee7f4fe7d/"
style="text-decoration: none; font-size: 10px; margin: 0;"
>
<img src="https://pikwizard.com/pw/medium/8d9098fb9e3a17a7d016102ee7f4fe7d.jpg" style="margin: 0; width: 100%;" alt="" />
<p style="font-size: 12px; margin: 0;">PikWizard</p>
</a>
</span>
</span>
Free (free of charge)
Free for personal and commercial use.
Author: AI Creator
Similar Free Stock Images

Premium


Premium


Premium


Premium


Premium


Premium


Premium


Premium


Premium


Premium


Premium


Premium


Premium


Premium


Premium


Premium


Premium


Premium


Premium


Premium


Premium


Premium


Premium


Premium