- Home >
- Stock Photos >
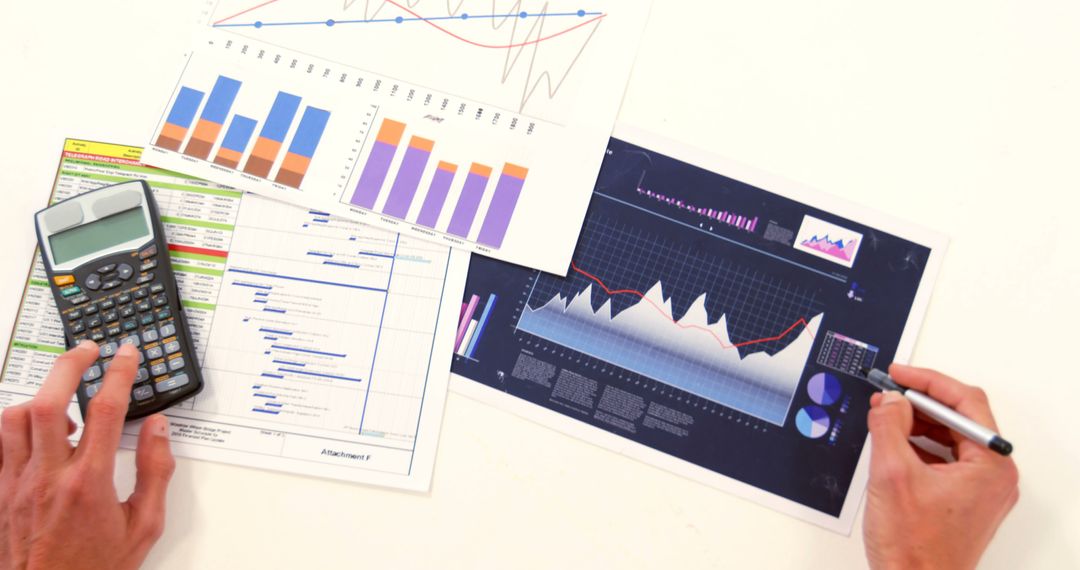
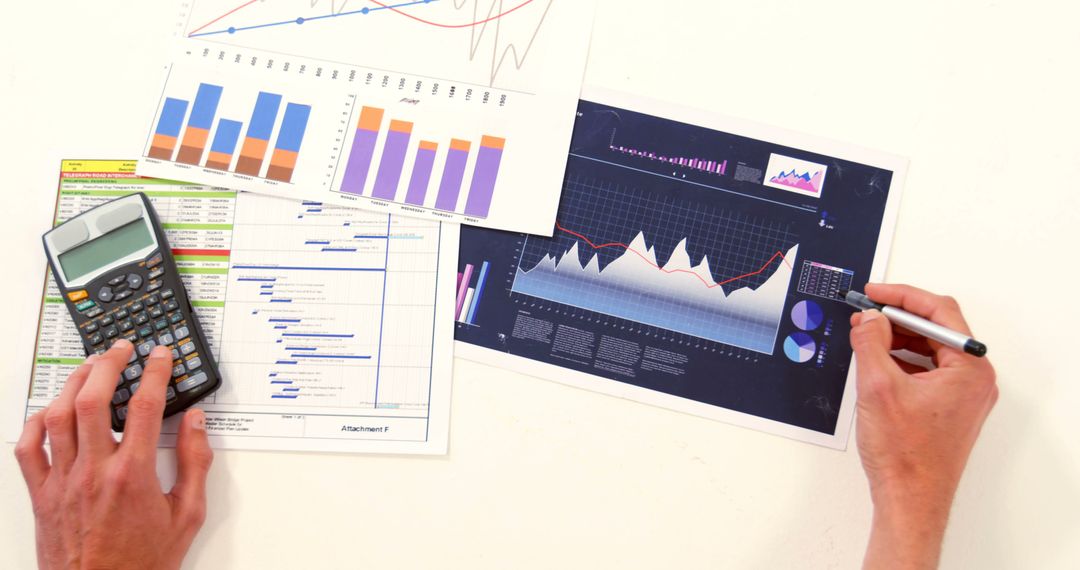
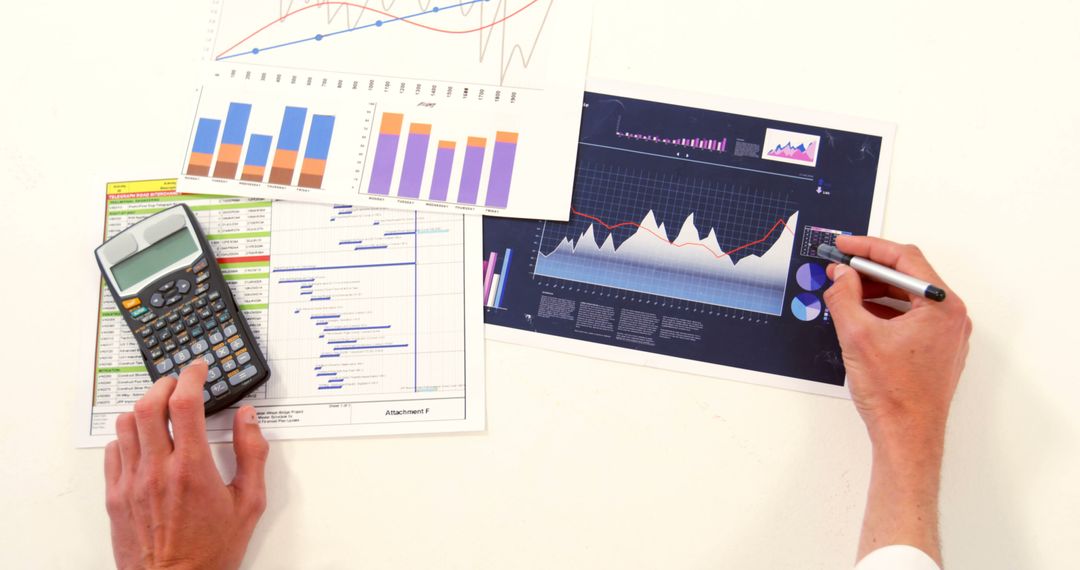
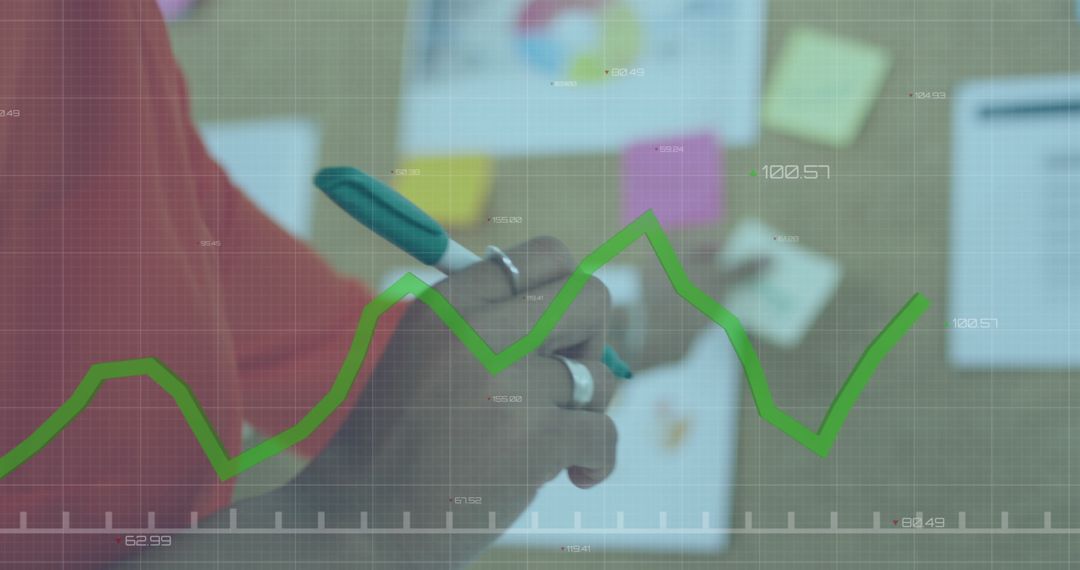
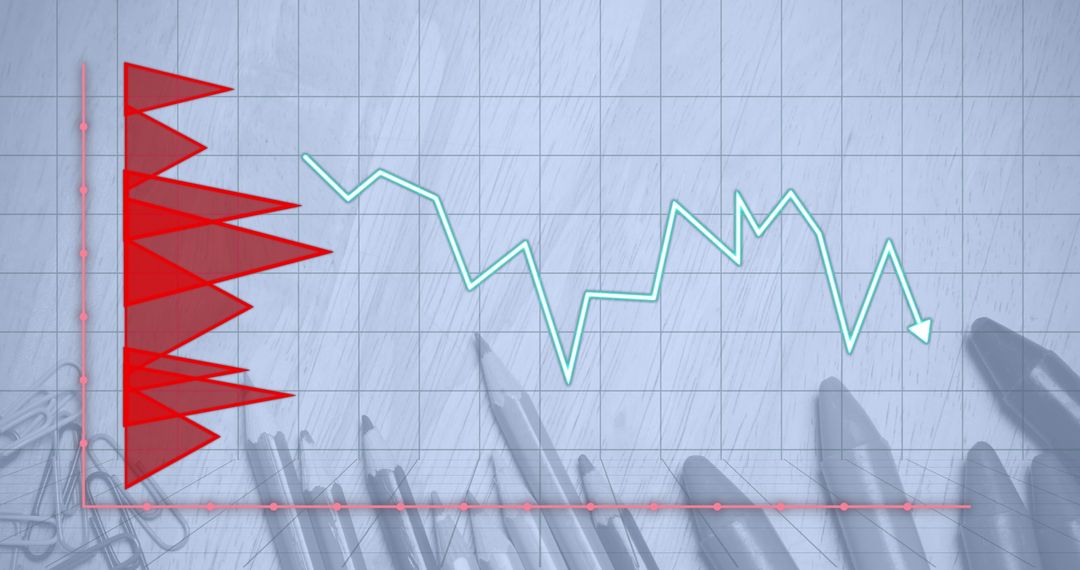
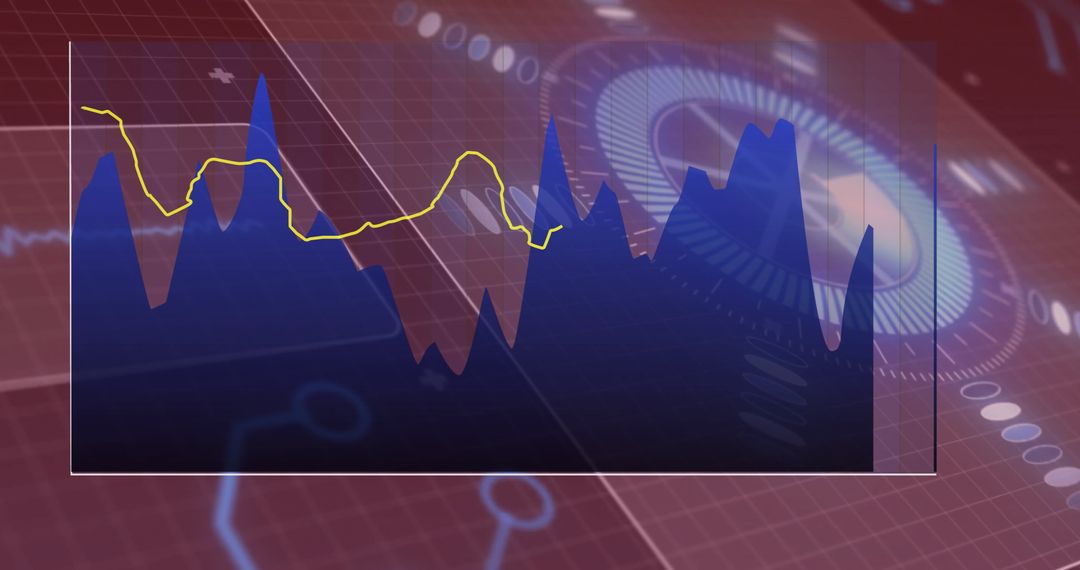
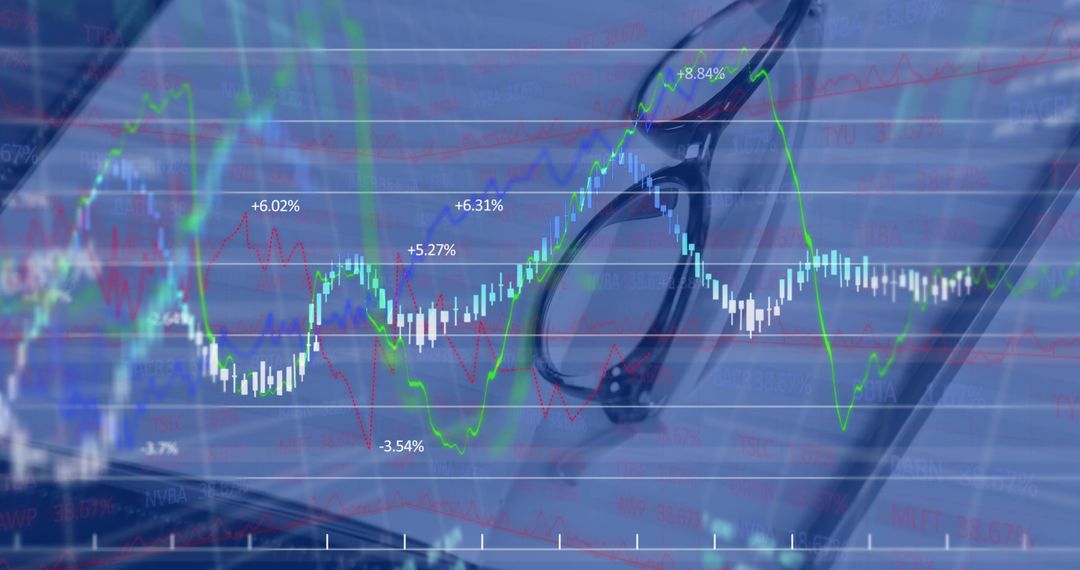
- Tablet displaying downward trend chart with analytics overlay on office desk, forms, pen
Tablet displaying downward trend chart with analytics overlay on office desk, forms, pen Image
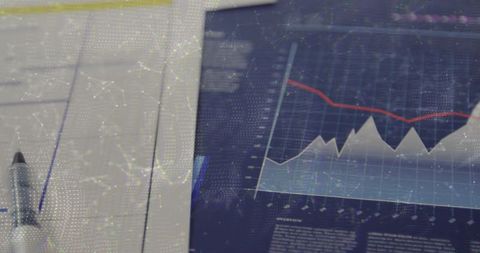
Showing tablet displaying downward trend area chart with red line and jagged peaks, placed on office desk with forms and pen. Featuring translucent network overlay suggesting data connectivity and analytics. Presenting cool blue tones and subtle blur for professional, modern look. Offering left-side copy space for headline, statistic, or logo. Working well for business presentations, financial reports, market analysis articles, investor communications, and blog posts about decline or risk. Serving as hero banner, slide deck background, social media post, newsletter header, or website illustration. Recommending cropping for horizontal headers and adding overlay text or icons to highlight key metrics.
Powered by 


0
downloads
downloads
Tags:
More
Credit Photo
If you would like to credit the Photo, here are some ways you can do so
Text Link
photo Link
<span class="text-link">
<span>
<a target="_blank" href=https://pikwizard.com/photo/tablet-displaying-downward-trend-chart-with-analytics-overlay-on-office-desk-forms-pen/24eeb96b3dae9f5f8a421a88cf589dad/>PikWizard</a>
</span>
</span>
<span class="image-link">
<span
style="margin: 0 0 20px 0; display: inline-block; vertical-align: middle; width: 100%;"
>
<a
target="_blank"
href="https://pikwizard.com/photo/tablet-displaying-downward-trend-chart-with-analytics-overlay-on-office-desk-forms-pen/24eeb96b3dae9f5f8a421a88cf589dad/"
style="text-decoration: none; font-size: 10px; margin: 0;"
>
<img src="https://pikwizard.com/pw/medium/24eeb96b3dae9f5f8a421a88cf589dad.jpg" style="margin: 0; width: 100%;" alt="" />
<p style="font-size: 12px; margin: 0;">PikWizard</p>
</a>
</span>
</span>
Free (free of charge)
Free for personal and commercial use.
Author: Awesome Content
Similar Free Stock Images

Premium


Premium


Premium


Premium


Premium


Premium


Premium


Premium


Premium


Premium


Premium


Premium


Premium


Premium


Premium


Premium


Premium


Premium


Premium


Premium


Premium


Premium


Premium


Premium