
- Home >
- Stock Photos >
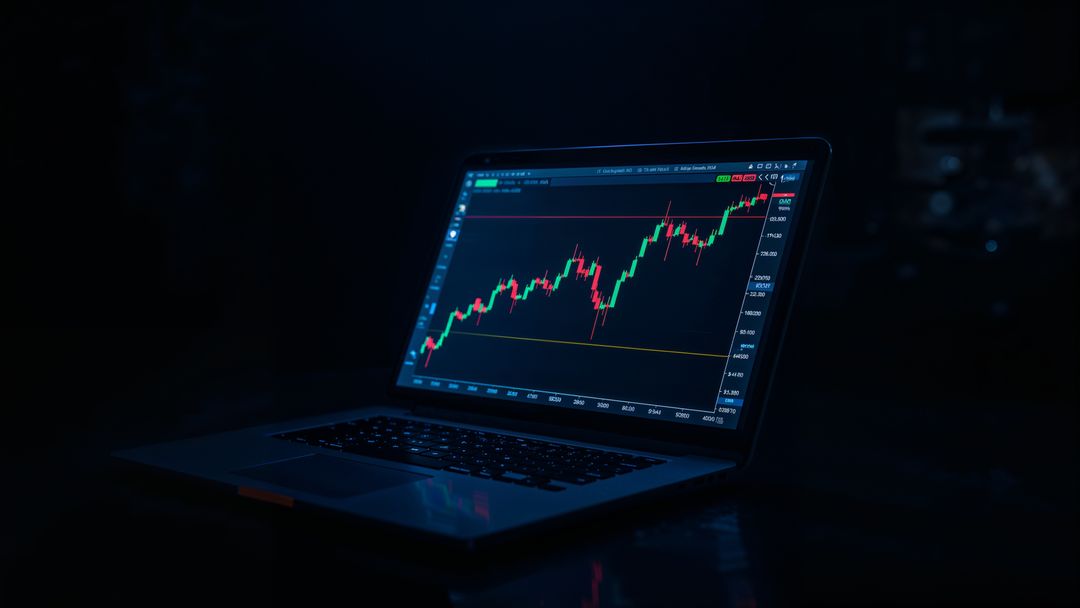
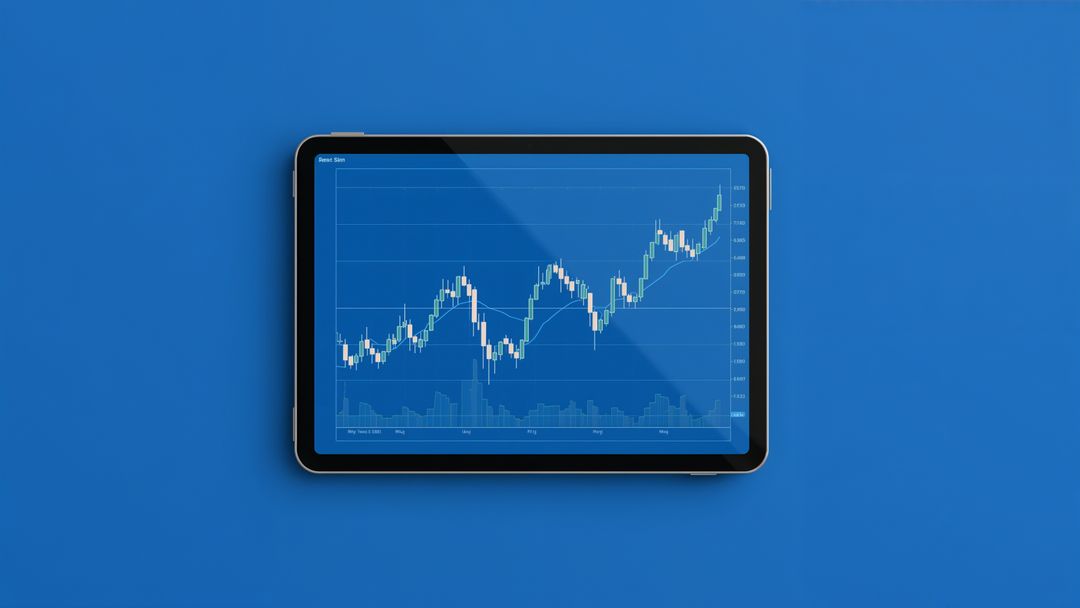
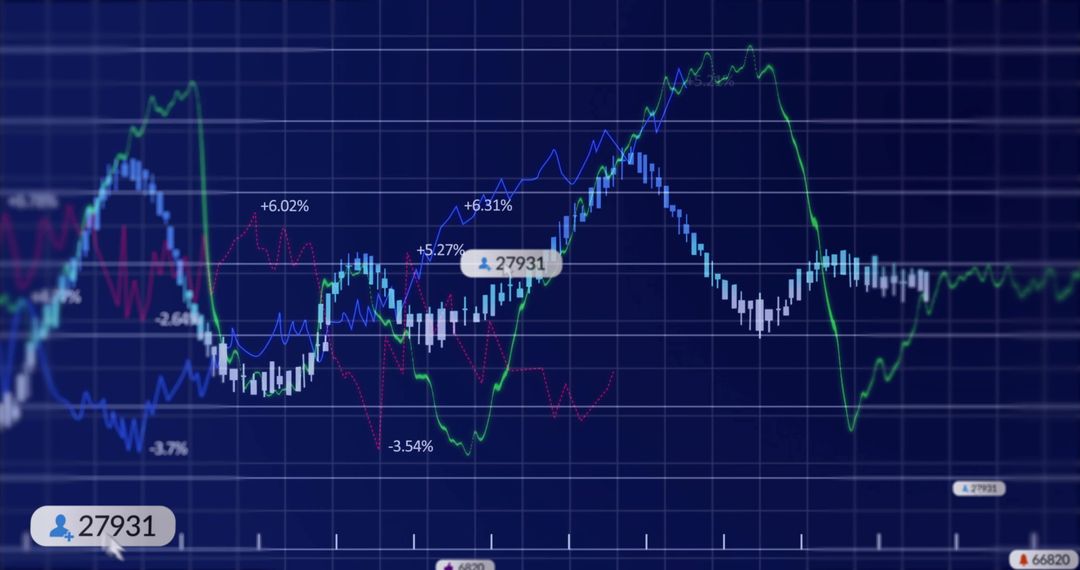
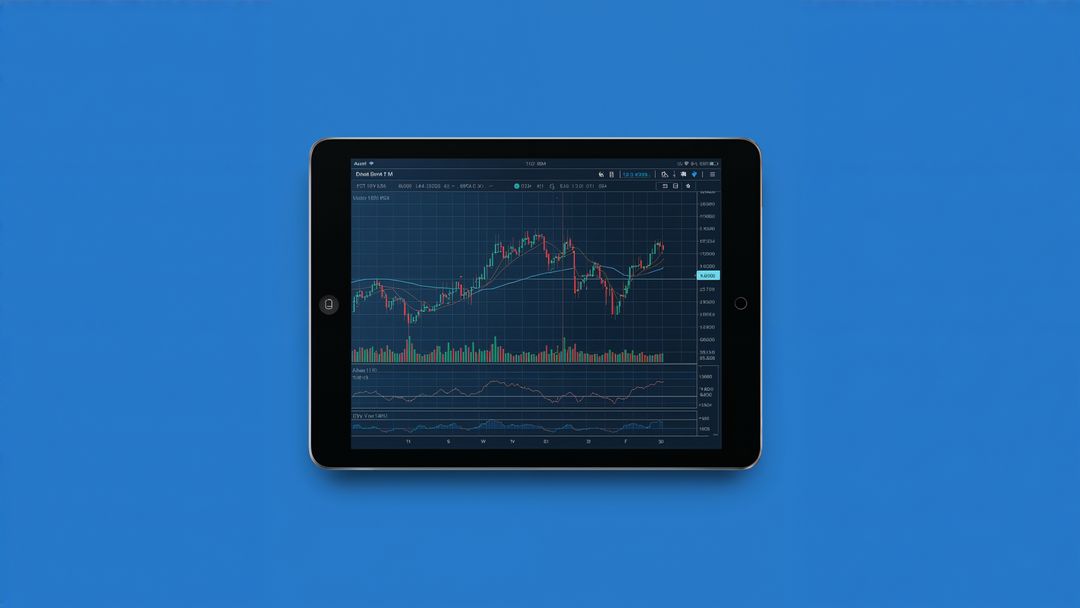
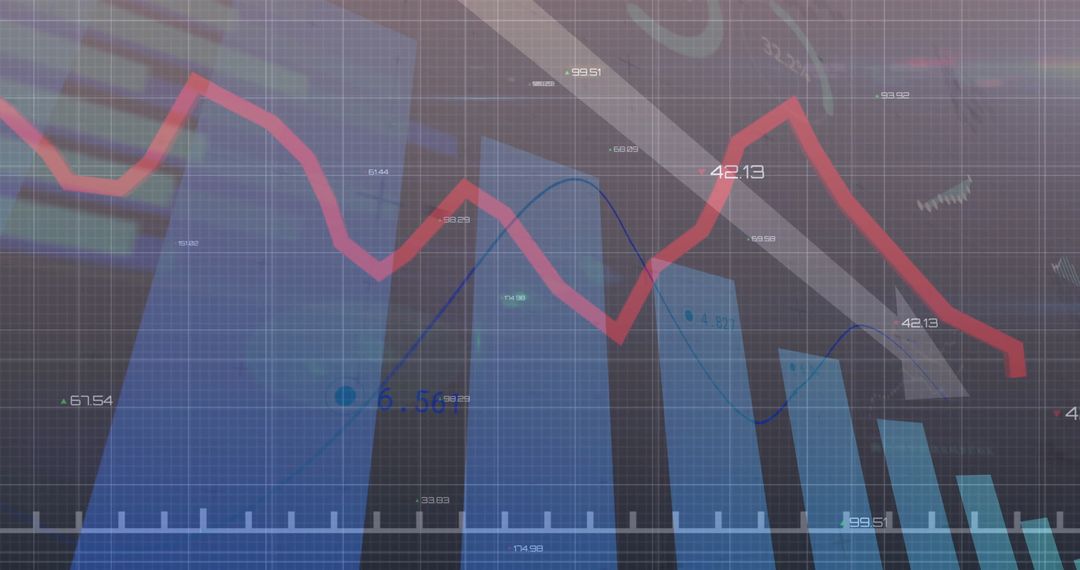
- Tablet Displaying Financial Trading Chart on Blue Background
Tablet Displaying Financial Trading Chart on Blue Background Image
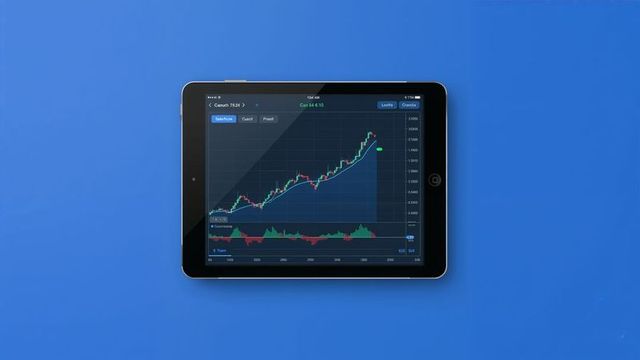
AI Generated Image. Tablet featuring a detailed financial trading application showing a candlestick chart and indicators on a clear blue background. Contains trade buttons and analytics interface suitable for concepts related to technology, stock market analysis, and digital finance platforms. Useful for illustrating modern trading tools, financial services marketing, or educational materials on investment strategies.
Powered by  - Get 15% off with code: PIKWIZARD15


0
downloads
downloads
Tags:
More
Credit Photo
If you would like to credit the Photo, here are some ways you can do so
Text Link
photo Link
<span class="text-link">
<span>
<a target="_blank" href=https://pikwizard.com/photo/tablet-displaying-financial-trading-chart-on-blue-background/502d17dcde3c7da9eb3eec9964dd89ad/>PikWizard</a>
</span>
</span>
<span class="image-link">
<span
style="margin: 0 0 20px 0; display: inline-block; vertical-align: middle; width: 100%;"
>
<a
target="_blank"
href="https://pikwizard.com/photo/tablet-displaying-financial-trading-chart-on-blue-background/502d17dcde3c7da9eb3eec9964dd89ad/"
style="text-decoration: none; font-size: 10px; margin: 0;"
>
<img src="https://pikwizard.com/pw/medium/502d17dcde3c7da9eb3eec9964dd89ad.jpg" style="margin: 0; width: 100%;" alt="" />
<p style="font-size: 12px; margin: 0;">PikWizard</p>
</a>
</span>
</span>
Free (free of charge)
Free for personal and commercial use.
Author: AI Creator
Similar Free Stock Images
Premium


Premium


Premium


Premium


Premium


Premium


Premium


Premium


Premium


Premium


Premium


Premium


Premium


Premium


Premium


Premium


Premium


Premium


Premium


Premium


Premium


Premium


Premium


Premium

