- Home >
- Stock Photos >
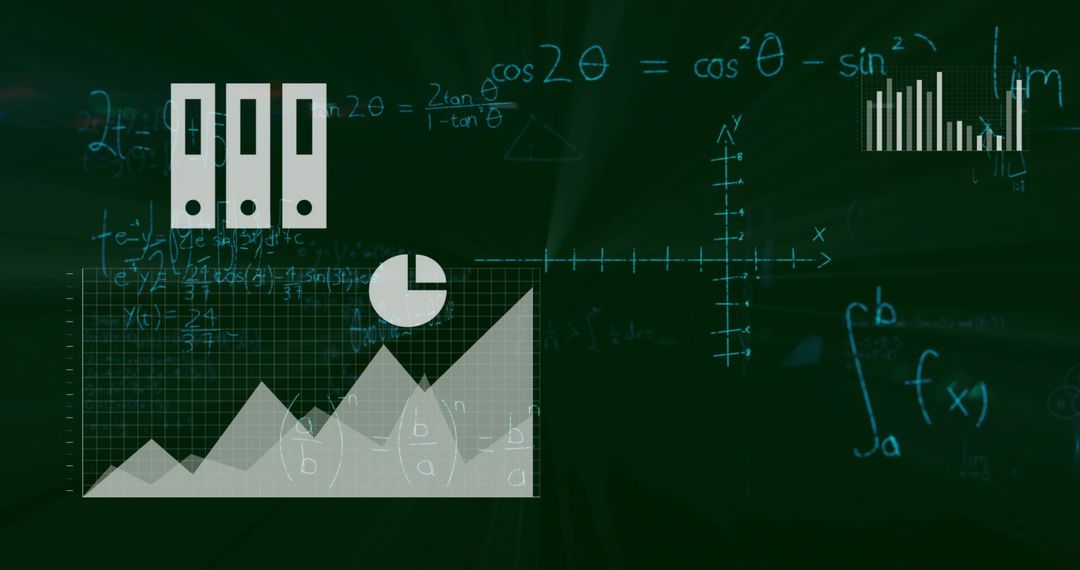
- Teaching chalkboard overlay displaying calculus formulas, bar charts and globe icons
Teaching chalkboard overlay displaying calculus formulas, bar charts and globe icons Image

Featuring chalkboard background overlaid with handwritten calculus formulas, integrals, function notation f(x), plotted graphs and vertical bar charts with subtle digital data accents. Globe icons and coordinate grid adding global analytics feel while faint code snippets and mathematical symbols reinforcing STEM and research themes. Color palette using deep green and muted blue tones creating academic, tech-forward mood. Usage ideas: Ideal for educational presentations, online course banners, textbook covers, lecture slides, STEM marketing materials, data science blog headers, research reports and infographic backgrounds. Layering text on empty space for headline or key statistics. Cropping for social media post, website hero banner or email header. Pairing with bold sans-serif fonts and clear call-to-action elements for course promotion or analytics product landing pages.
Powered by  - Get 15% off with code: PIKWIZARD15


0
downloads
downloads
Tags:
More
Credit Photo
If you would like to credit the Photo, here are some ways you can do so
Text Link
photo Link
<span class="text-link">
<span>
<a target="_blank" href=https://pikwizard.com/photo/teaching-chalkboard-overlay-displaying-calculus-formulas-bar-charts-and-globe-icons/84b55bc0976d0ee25311b16dda0026b8/>PikWizard</a>
</span>
</span>
<span class="image-link">
<span
style="margin: 0 0 20px 0; display: inline-block; vertical-align: middle; width: 100%;"
>
<a
target="_blank"
href="https://pikwizard.com/photo/teaching-chalkboard-overlay-displaying-calculus-formulas-bar-charts-and-globe-icons/84b55bc0976d0ee25311b16dda0026b8/"
style="text-decoration: none; font-size: 10px; margin: 0;"
>
<img src="https://pikwizard.com/pw/medium/84b55bc0976d0ee25311b16dda0026b8.jpg" style="margin: 0; width: 100%;" alt="" />
<p style="font-size: 12px; margin: 0;">PikWizard</p>
</a>
</span>
</span>
Free (free of charge)
Free for personal and commercial use.
Author: Authentic Images
Similar Free Stock Images

Premium


Premium


Premium


Premium


Premium


Premium