- Home >
- Stock Photos >
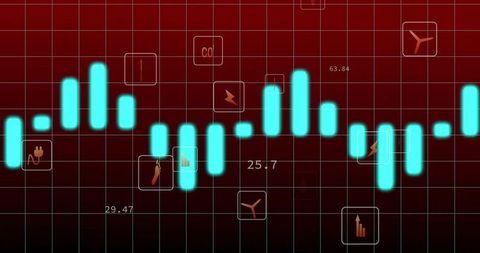
- Teal Data Bar Chart with World Map and Code Elements
Teal Data Bar Chart with World Map and Code Elements Image

Teal bars form a digital chart superimposed on a background featuring a global map and code snippets. Highlights modern analytics and digital transformation themes. Ideal for use in presentations on data analytics, business intelligence, technology innovations, and global market reports. Could also serve as a background for tech-focused websites or reports.

downloads
Tags:
More
Credit Photo
If you would like to credit the Photo, here are some ways you can do so
Text Link
photo Link
<span class="text-link">
<span>
<a target="_blank" href=https://pikwizard.com/photo/teal-data-bar-chart-with-world-map-and-code-elements/5607b2c858da95f9cc102a14ee7e6ef4/>PikWizard</a>
</span>
</span>
<span class="image-link">
<span
style="margin: 0 0 20px 0; display: inline-block; vertical-align: middle; width: 100%;"
>
<a
target="_blank"
href="https://pikwizard.com/photo/teal-data-bar-chart-with-world-map-and-code-elements/5607b2c858da95f9cc102a14ee7e6ef4/"
style="text-decoration: none; font-size: 10px; margin: 0;"
>
<img src="https://pikwizard.com/pw/medium/5607b2c858da95f9cc102a14ee7e6ef4.jpg" style="margin: 0; width: 100%;" alt="" />
<p style="font-size: 12px; margin: 0;">PikWizard</p>
</a>
</span>
</span>
Free (free of charge)
Free for personal and commercial use.
Author: Creative Art