- Home >
- Stock Photos >
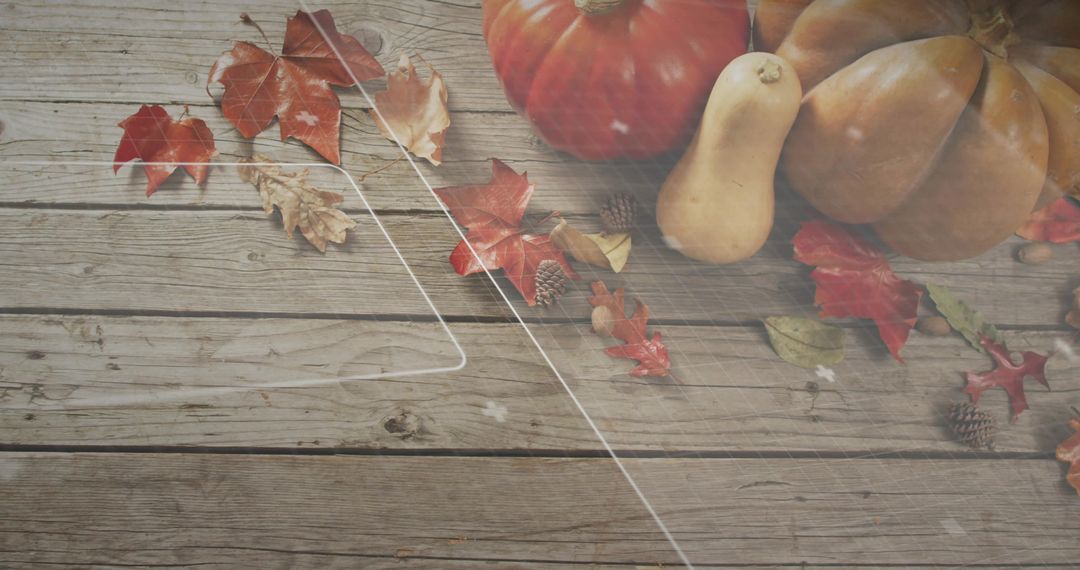
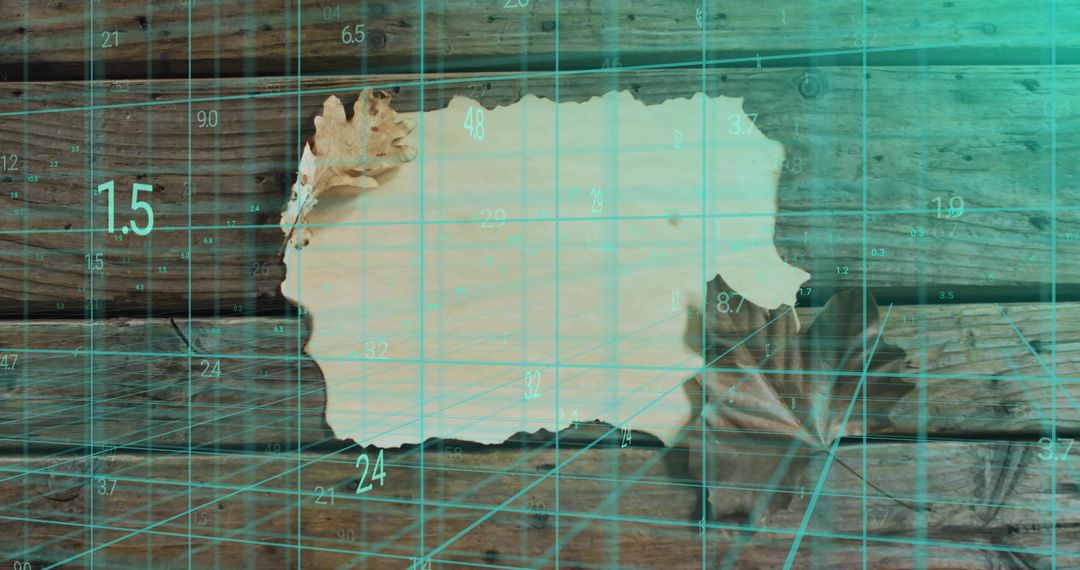
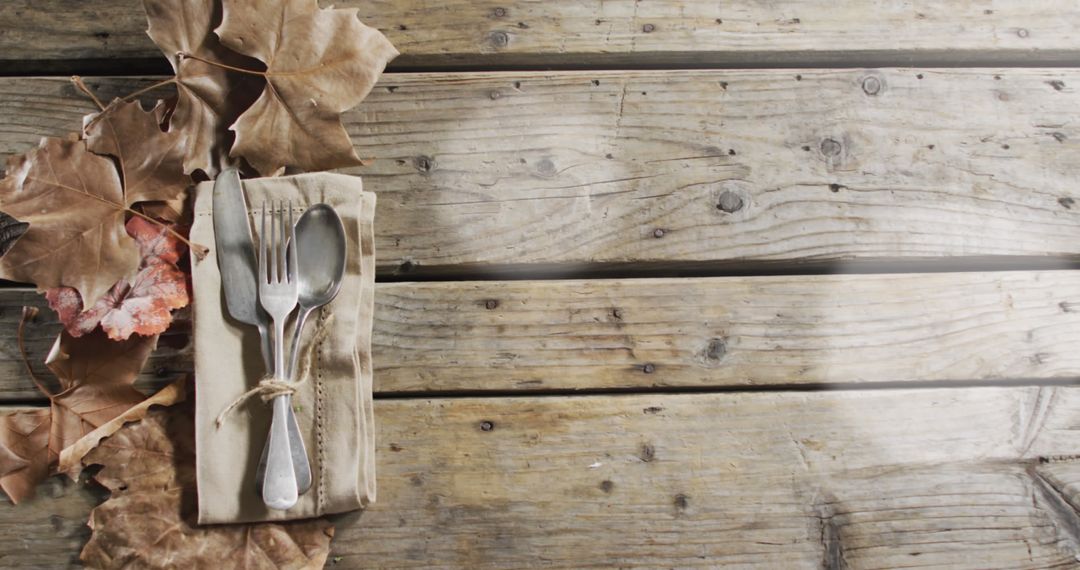
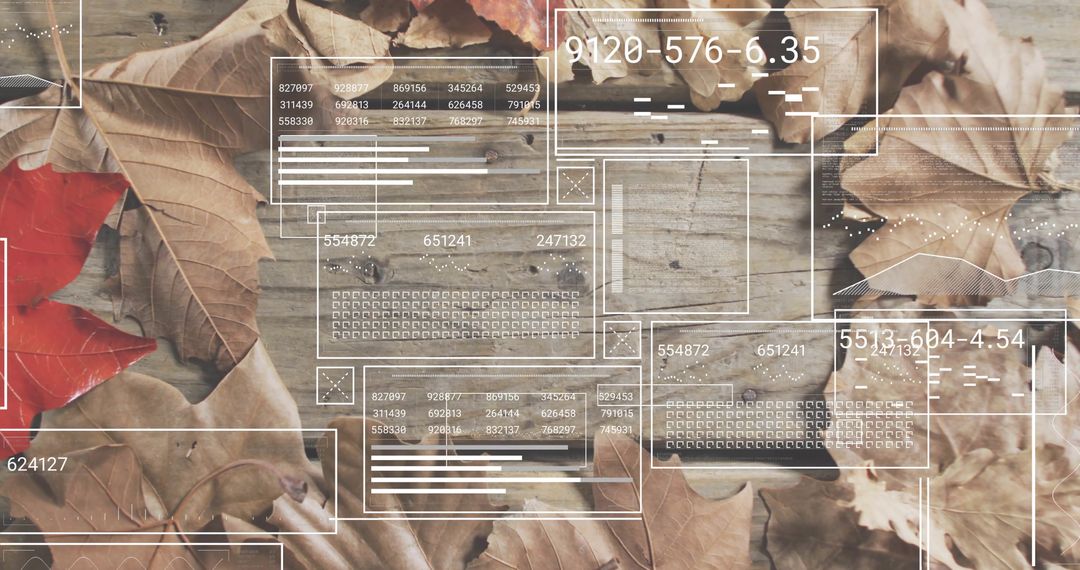
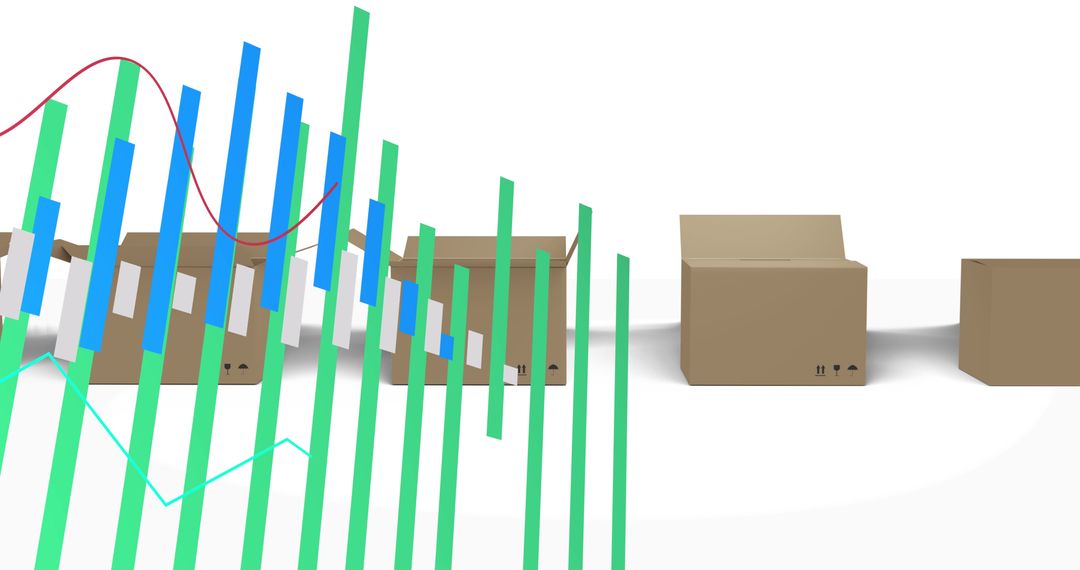
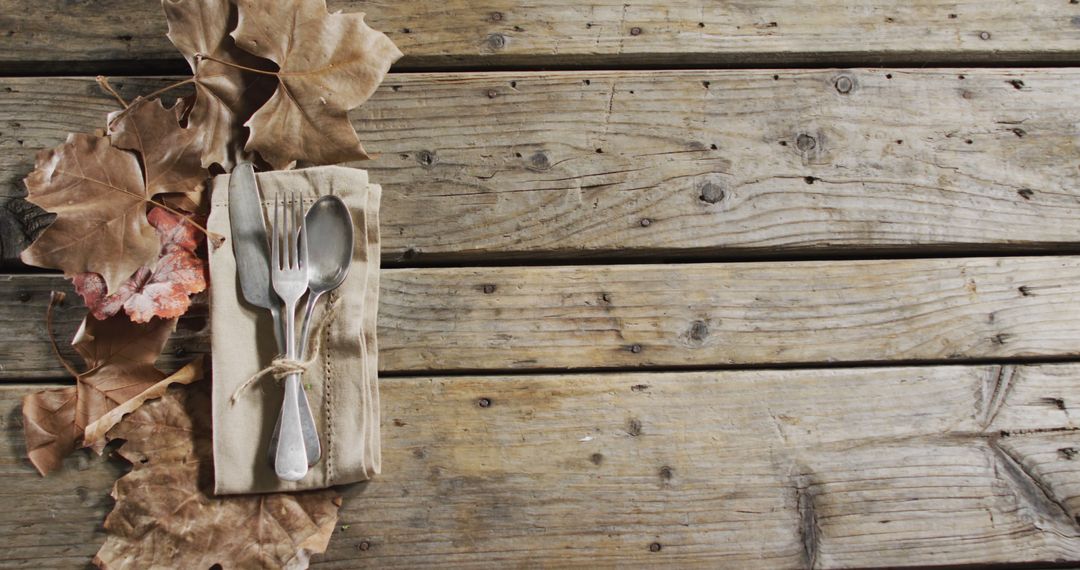
- Teal Data Overlaying Rustic Wooden Tabletop with Bar Chart and Line Graph Visualization
Teal Data Overlaying Rustic Wooden Tabletop with Bar Chart and Line Graph Visualization Image

Composition featuring teal data overlaying rustic wooden planks, bar chart and descending line graph crossing over wrapped cutlery and autumn leaves. Visual blending vintage wood texture with modern analytics graphics, creating contrast between tactile grain and translucent turquoise overlays, and suggesting data-driven insight with seasonal or hospitality focus. Use for website hero banners, fintech or analytics blog headers, restaurant performance reports, menu pricing presentations, social media marketing for seasonal campaigns, annual report covers, infographic backgrounds, and slide deck visuals. Crop-friendly layout with open space on right for headline, call-to-action, or logo. Color palette pairing turquoise and teal with warm brown and muted orange for cohesive branding.
Powered by  - Get 15% off with code: PIKWIZARD15


0
downloads
downloads
Tags:
More
Credit Photo
If you would like to credit the Photo, here are some ways you can do so
Text Link
photo Link
<span class="text-link">
<span>
<a target="_blank" href=https://pikwizard.com/photo/teal-data-overlaying-rustic-wooden-tabletop-with-bar-chart-and-line-graph-visualization/bf35fe4de5a8796f1d5751d5dcb4a2a4/>PikWizard</a>
</span>
</span>
<span class="image-link">
<span
style="margin: 0 0 20px 0; display: inline-block; vertical-align: middle; width: 100%;"
>
<a
target="_blank"
href="https://pikwizard.com/photo/teal-data-overlaying-rustic-wooden-tabletop-with-bar-chart-and-line-graph-visualization/bf35fe4de5a8796f1d5751d5dcb4a2a4/"
style="text-decoration: none; font-size: 10px; margin: 0;"
>
<img src="https://pikwizard.com/pw/medium/bf35fe4de5a8796f1d5751d5dcb4a2a4.jpg" style="margin: 0; width: 100%;" alt="" />
<p style="font-size: 12px; margin: 0;">PikWizard</p>
</a>
</span>
</span>
Free (free of charge)
Free for personal and commercial use.
Author: Authentic Images
Similar Free Stock Images

Premium


Premium


Premium


Premium


Premium


Premium


Premium


Premium


Premium


Premium


Premium


Premium


Premium


Premium


Premium


Premium


Premium


Premium


Premium


Premium


Premium


Premium


Premium


Premium