- Home >
- Stock Photos >
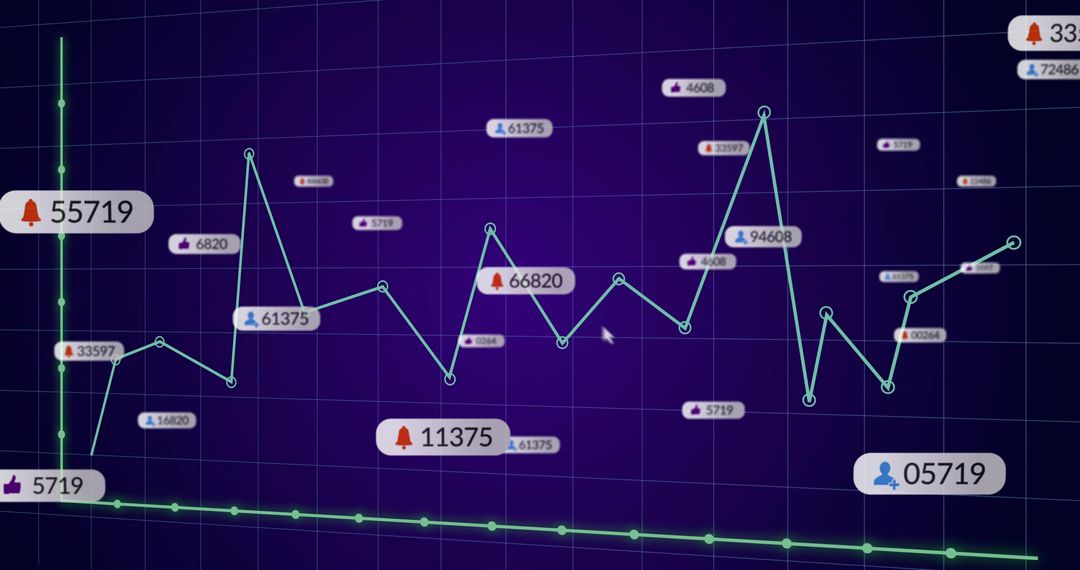
- Teal Line Graph with Social Metrics and User Engagement Data
Teal Line Graph with Social Metrics and User Engagement Data Image

Displaying dynamic teal line graph intersected with likes and notifications on a modern analytics grid. This visual representation highlights insights into social media performance, perfect for use in reports, digital platforms, and presentations involving data analysis, user engagement trends, or technology-driven insights.
Powered by  - Get 15% off with code: PIKWIZARD15


0
downloads
downloads
Tags:
More
Credit Photo
If you would like to credit the Photo, here are some ways you can do so
Text Link
photo Link
<span class="text-link">
<span>
<a target="_blank" href=https://pikwizard.com/photo/teal-line-graph-with-social-metrics-and-user-engagement-data/d0ad77df658d587482388f41f75707c0/>PikWizard</a>
</span>
</span>
<span class="image-link">
<span
style="margin: 0 0 20px 0; display: inline-block; vertical-align: middle; width: 100%;"
>
<a
target="_blank"
href="https://pikwizard.com/photo/teal-line-graph-with-social-metrics-and-user-engagement-data/d0ad77df658d587482388f41f75707c0/"
style="text-decoration: none; font-size: 10px; margin: 0;"
>
<img src="https://pikwizard.com/pw/medium/d0ad77df658d587482388f41f75707c0.jpg" style="margin: 0; width: 100%;" alt="" />
<p style="font-size: 12px; margin: 0;">PikWizard</p>
</a>
</span>
</span>
Free (free of charge)
Free for personal and commercial use.
Author: Awesome Content
Similar Free Stock Images