- Home >
- Stock Photos >
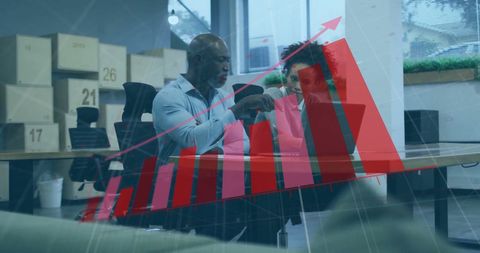
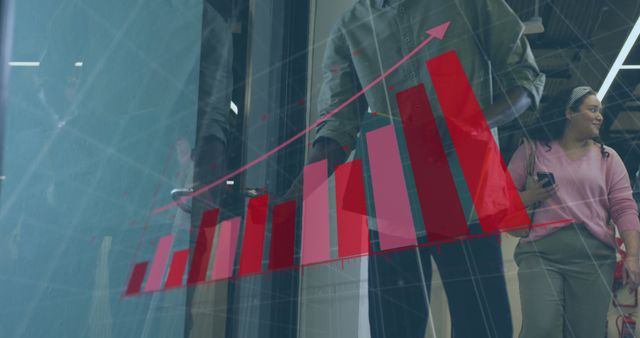
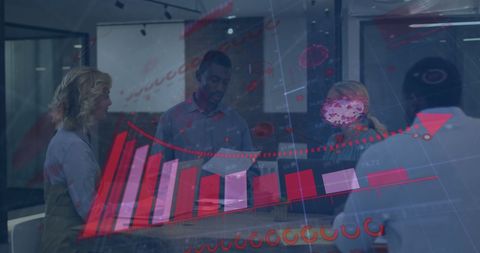
- Team Analyzing Downward Business Trends with Graph Overlay
Team Analyzing Downward Business Trends with Graph Overlay Image

This image depicts a diverse group of coworkers involved in a discussion, complemented by a downward-trending graph laid over the scene, likely representing challenging business conditions or losses. Sticky notes filled with strategies are visible as the team actively brainstorms solutions. Perfect for content related to business analysis, strategic planning sessions, teamwork in corporate environments, discussing financial risks, or presentations on addressing downturns.
Powered by  - Get 15% off with code: PIKWIZARD15


2
downloads
downloads
Tags:
More
Credit Photo
If you would like to credit the Photo, here are some ways you can do so
Text Link
photo Link
<span class="text-link">
<span>
<a target="_blank" href=https://pikwizard.com/photo/team-analyzing-downward-business-trends-with-graph-overlay/78a9d705efa0894b9cb087fc69d671b5/>PikWizard</a>
</span>
</span>
<span class="image-link">
<span
style="margin: 0 0 20px 0; display: inline-block; vertical-align: middle; width: 100%;"
>
<a
target="_blank"
href="https://pikwizard.com/photo/team-analyzing-downward-business-trends-with-graph-overlay/78a9d705efa0894b9cb087fc69d671b5/"
style="text-decoration: none; font-size: 10px; margin: 0;"
>
<img src="https://pikwizard.com/pw/medium/78a9d705efa0894b9cb087fc69d671b5.jpg" style="margin: 0; width: 100%;" alt="" />
<p style="font-size: 12px; margin: 0;">PikWizard</p>
</a>
</span>
</span>
Free (free of charge)
Free for personal and commercial use.
Author: Authentic Images