
- Home >
- Stock Photos >
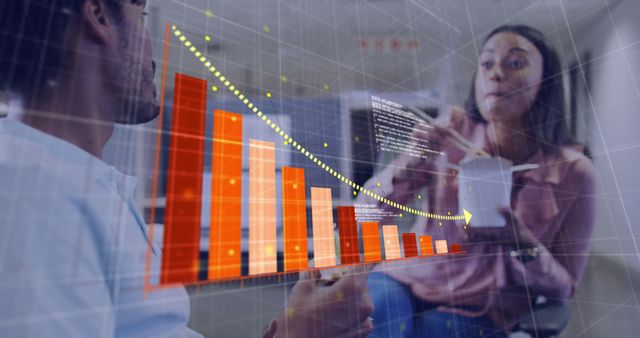
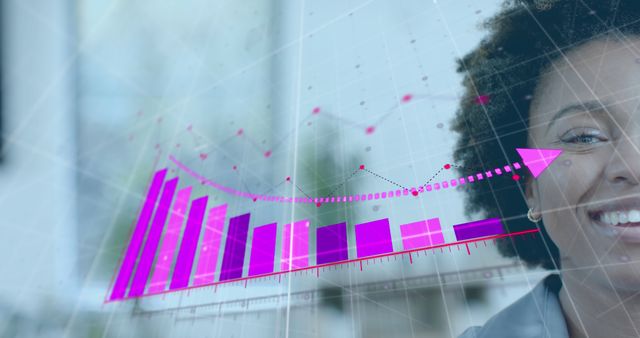
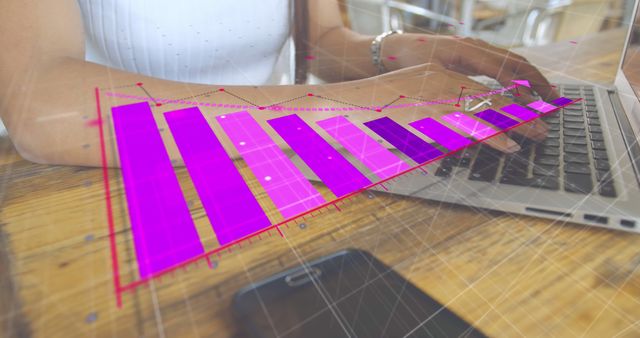
- Team Analyzing Financial Data Trends with Virtual Graph
Team Analyzing Financial Data Trends with Virtual Graph Image

Photo depicts a team engaged in analyzing financial trends shown by a digital graph overlay on laptops. Ideal for articles on economic trends, business analytics, digital collaboration, or financial forecasting presentations.
Powered by 


downloads
Tags:
More
Credit Photo
If you would like to credit the Photo, here are some ways you can do so
Text Link
photo Link
<span class="text-link">
<span>
<a target="_blank" href=https://pikwizard.com/photo/team-analyzing-financial-data-trends-with-virtual-graph/27b8a8ed9dbdbf05f9d57767f22fb9d1/>PikWizard</a>
</span>
</span>
<span class="image-link">
<span
style="margin: 0 0 20px 0; display: inline-block; vertical-align: middle; width: 100%;"
>
<a
target="_blank"
href="https://pikwizard.com/photo/team-analyzing-financial-data-trends-with-virtual-graph/27b8a8ed9dbdbf05f9d57767f22fb9d1/"
style="text-decoration: none; font-size: 10px; margin: 0;"
>
<img src="https://pikwizard.com/pw/medium/27b8a8ed9dbdbf05f9d57767f22fb9d1.jpg" style="margin: 0; width: 100%;" alt="" />
<p style="font-size: 12px; margin: 0;">PikWizard</p>
</a>
</span>
</span>
Free (free of charge)
Free for personal and commercial use.
Author: Authentic Images
Similar Free Stock Images

Premium


Premium

Premium


Premium


Premium

Premium


Premium


Premium


Premium


Premium


Premium

Premium


Premium


Premium


Premium

Premium


Premium


Premium


Premium


Premium


Premium


Premium


Premium


Premium


Premium


Explore More Free Stock Images