- Home >
- Stock Photos >
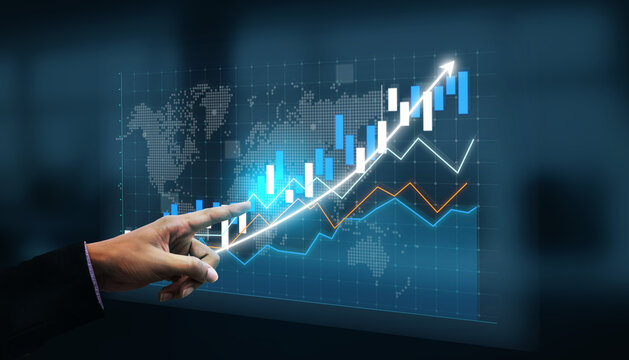
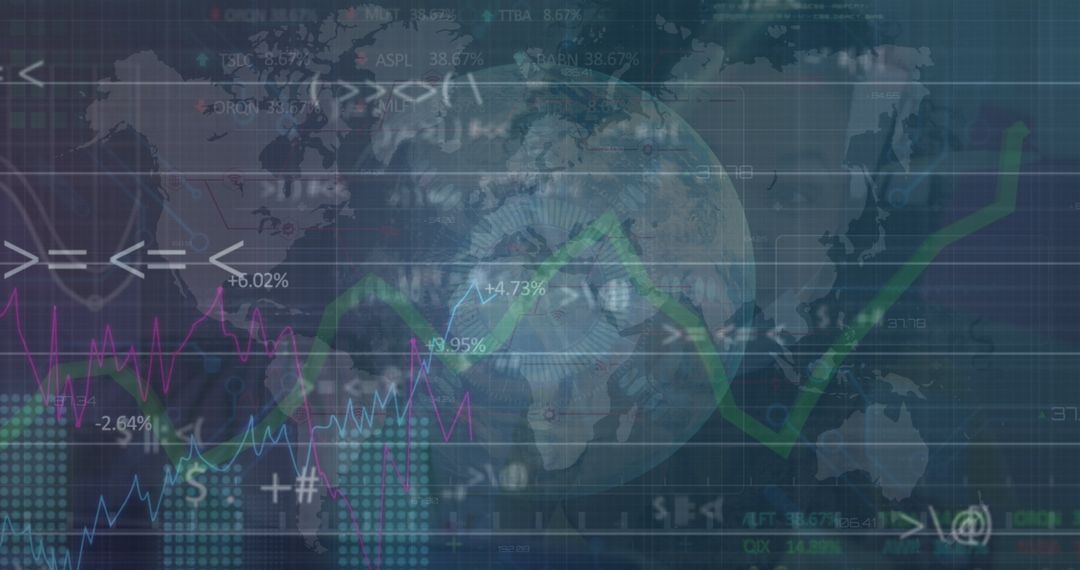
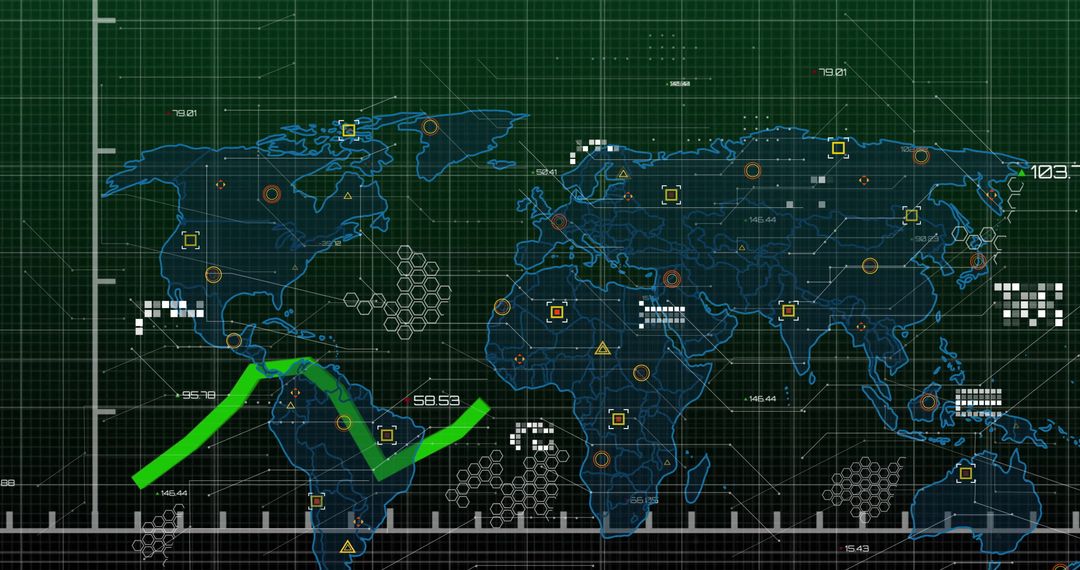
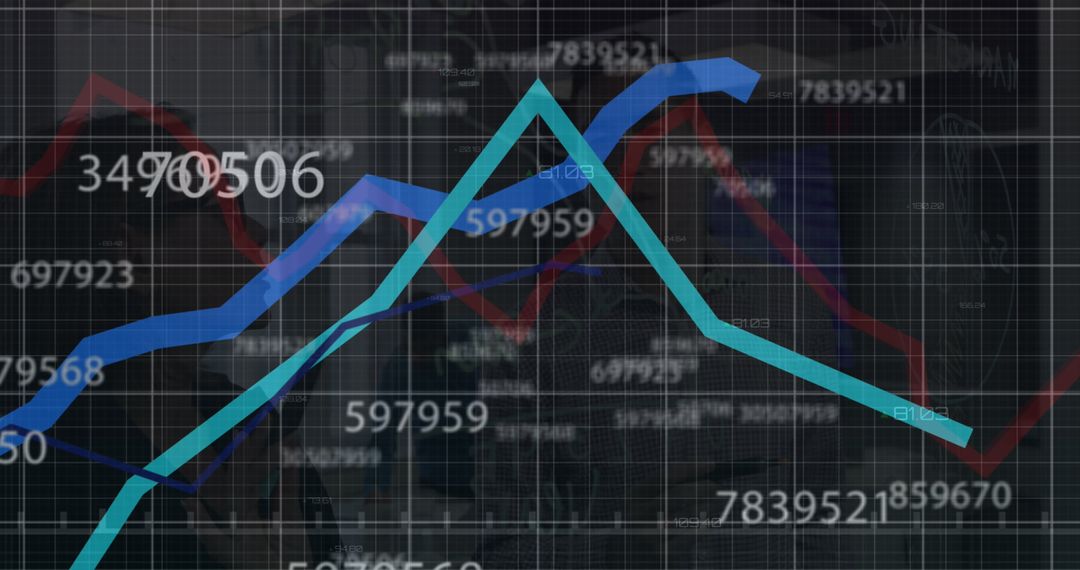
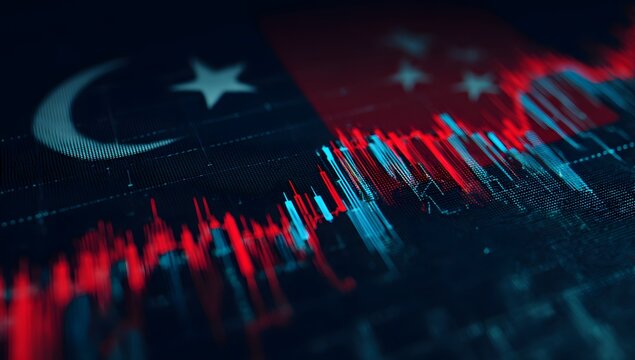
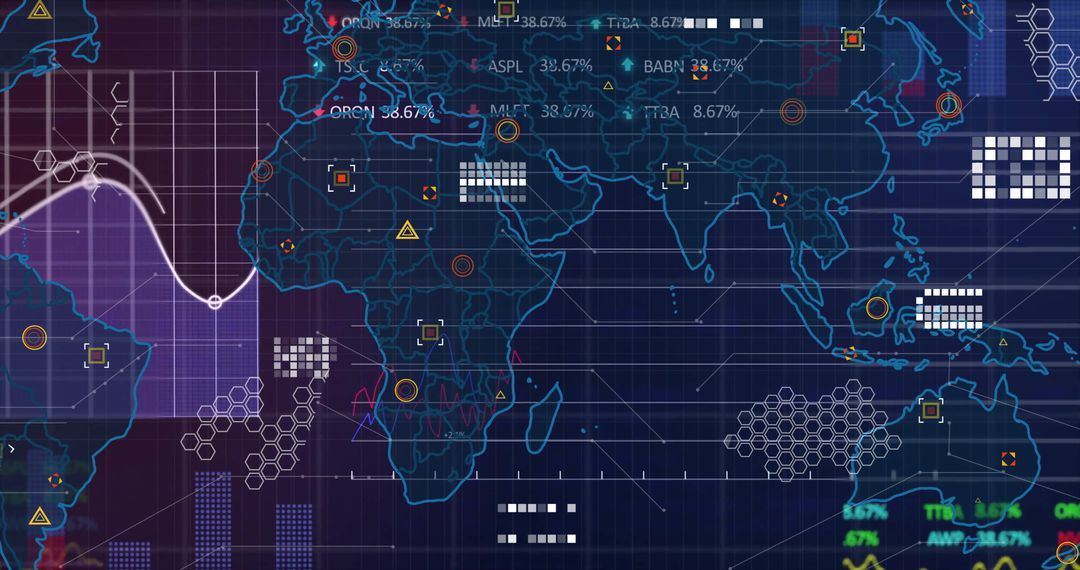
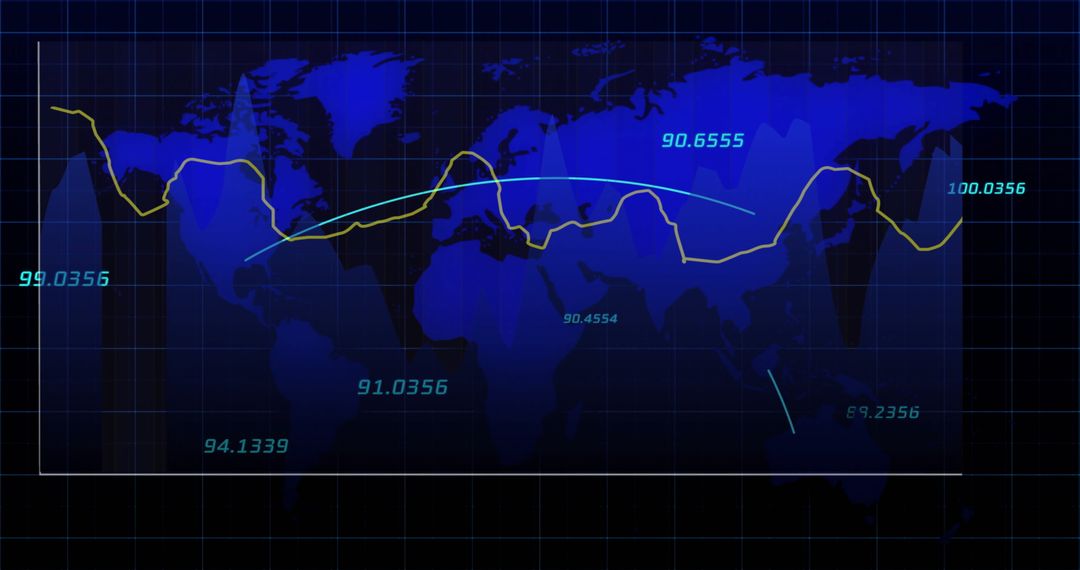
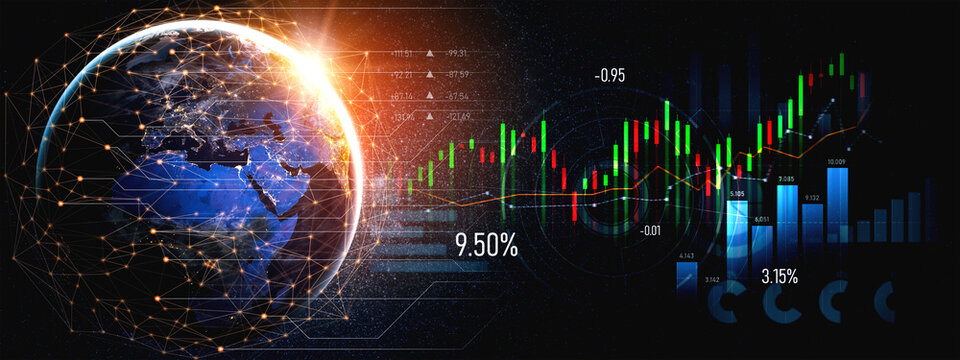
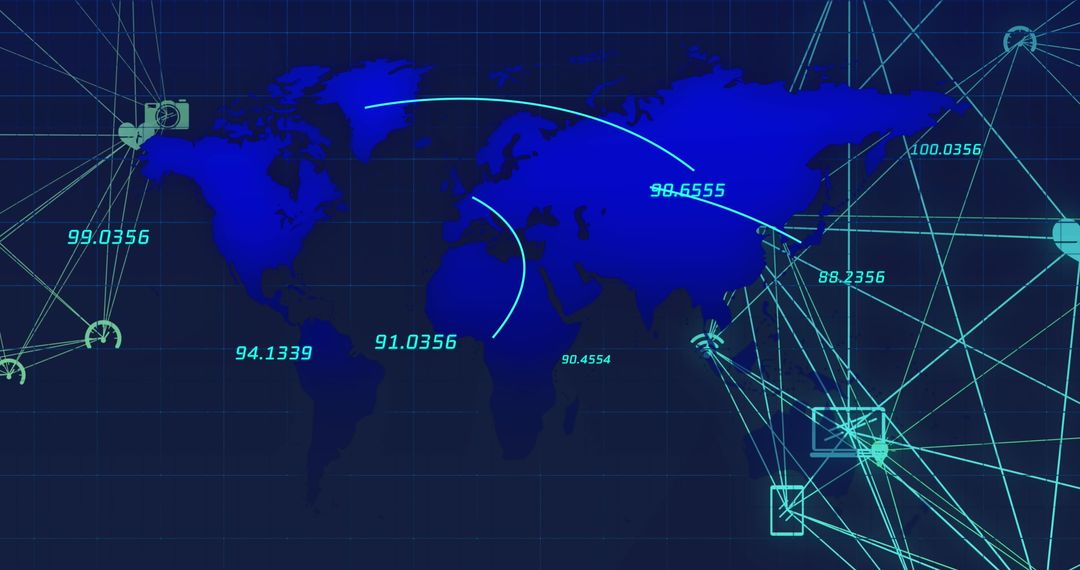
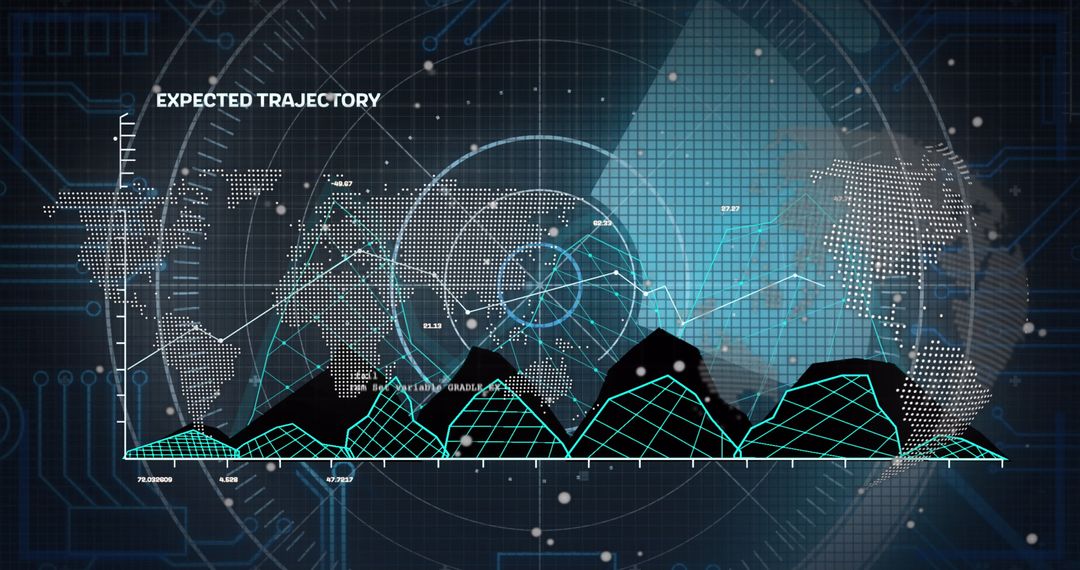
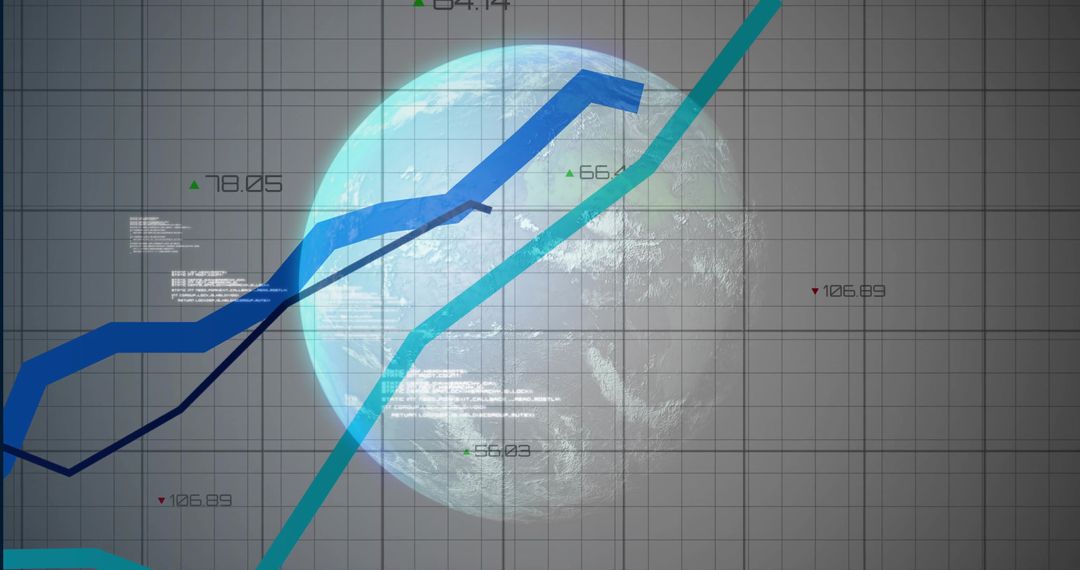
- Technological Analysis of Global Financial Trends with Digital Graphs
Technological Analysis of Global Financial Trends with Digital Graphs Image
Visual depiction blends a digital graph with globe, symbolizing intricate financial analysis. Useful for presentations on global economic trends, statistics review, and data-driven decision making in technology and finance sectors.
Powered by 


6
downloads
downloads
Tags:
More
Credit Photo
If you would like to credit the Photo, here are some ways you can do so
Text Link
photo Link
<span class="text-link">
<span>
<a target="_blank" href=https://pikwizard.com/photo/technological-analysis-of-global-financial-trends-with-digital-graphs/d7782a840877d57c9c02aa1e8dcdaca2/>PikWizard</a>
</span>
</span>
<span class="image-link">
<span
style="margin: 0 0 20px 0; display: inline-block; vertical-align: middle; width: 100%;"
>
<a
target="_blank"
href="https://pikwizard.com/photo/technological-analysis-of-global-financial-trends-with-digital-graphs/d7782a840877d57c9c02aa1e8dcdaca2/"
style="text-decoration: none; font-size: 10px; margin: 0;"
>
<img src="https://pikwizard.com/pw/medium/d7782a840877d57c9c02aa1e8dcdaca2.jpg" style="margin: 0; width: 100%;" alt="" />
<p style="font-size: 12px; margin: 0;">PikWizard</p>
</a>
</span>
</span>
Free (free of charge)
Free for personal and commercial use.
Author: Awesome Content
Similar Free Stock Images

Premium


Premium


Premium


Premium


Premium


Premium


Premium


Premium


Premium


Premium


Premium


Premium


Premium

Premium


Premium


Premium


Premium


Premium


Premium


Premium


Premium


Premium


Premium


Premium