
- Home >
- Stock Photos >
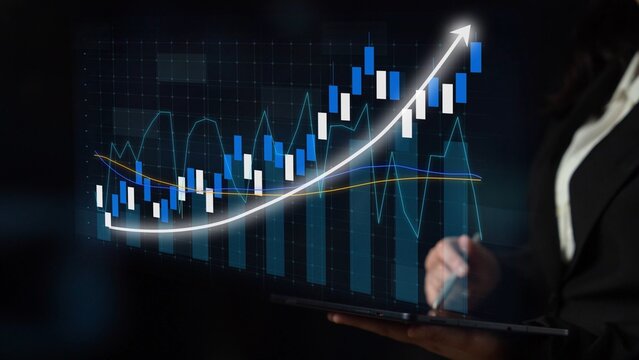
- Technological Interface Showing Financial Market Data Process
Technological Interface Showing Financial Market Data Process Image

Illustration depicting a digital interface with fluctuating market data through colorful graph lines. Ideal for use in finance, economy, technology, or fintech websites to showcase market analysis and stock trends. Also suitable for presentations and reports focusing on technological advancements or economic forecasts. A compelling visual representation of data analysis in business strategies.
Powered by 


downloads
Tags:
More
Credit Photo
If you would like to credit the Photo, here are some ways you can do so
Text Link
photo Link
<span class="text-link">
<span>
<a target="_blank" href=https://pikwizard.com/photo/technological-interface-showing-financial-market-data-process/cd54a888e927d9416f6cbd3a81f5a0ff/>PikWizard</a>
</span>
</span>
<span class="image-link">
<span
style="margin: 0 0 20px 0; display: inline-block; vertical-align: middle; width: 100%;"
>
<a
target="_blank"
href="https://pikwizard.com/photo/technological-interface-showing-financial-market-data-process/cd54a888e927d9416f6cbd3a81f5a0ff/"
style="text-decoration: none; font-size: 10px; margin: 0;"
>
<img src="https://pikwizard.com/pw/medium/cd54a888e927d9416f6cbd3a81f5a0ff.jpg" style="margin: 0; width: 100%;" alt="" />
<p style="font-size: 12px; margin: 0;">PikWizard</p>
</a>
</span>
</span>
Free (free of charge)
Free for personal and commercial use.
Author: Creative Art
Similar Free Stock Images

Premium


Premium


Premium


Premium


Premium


Premium


Premium


Premium

Premium


Premium


Premium


Premium


Premium


Premium

Premium


Premium


Premium


Premium


Premium


Premium


Premium


Premium


Premium


Premium


Premium


Explore More Free Stock Images