- Home >
- Stock Photos >
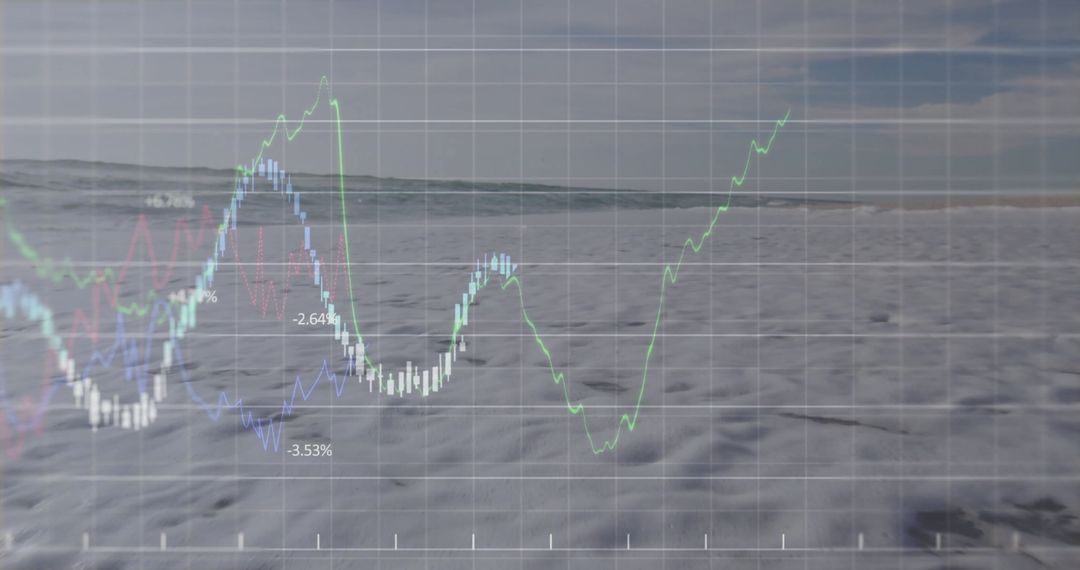
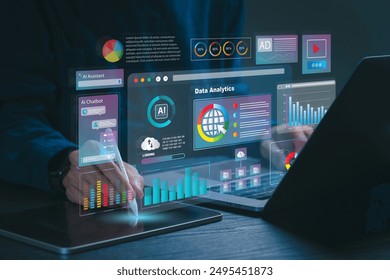
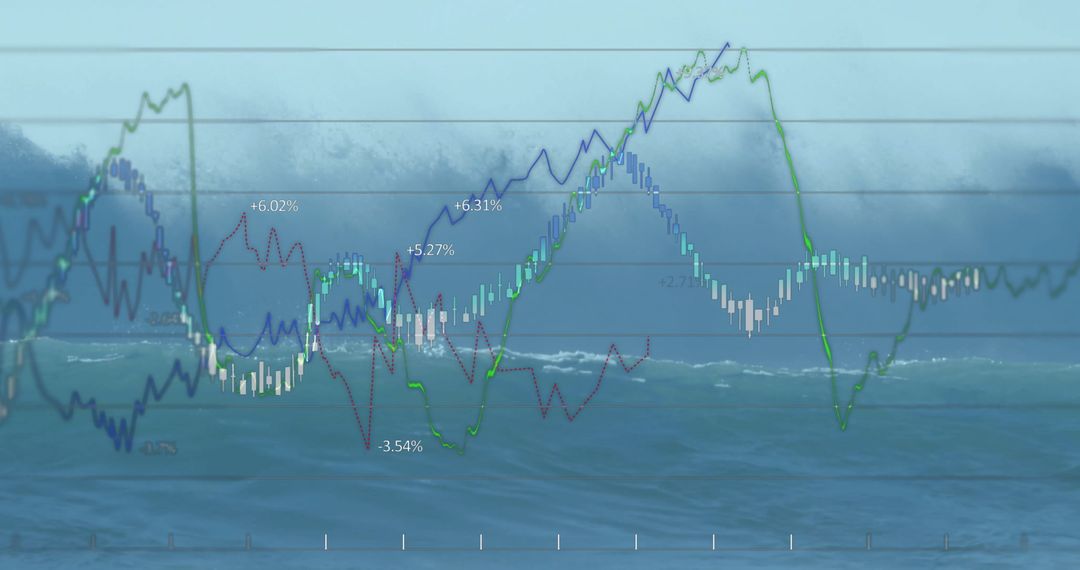
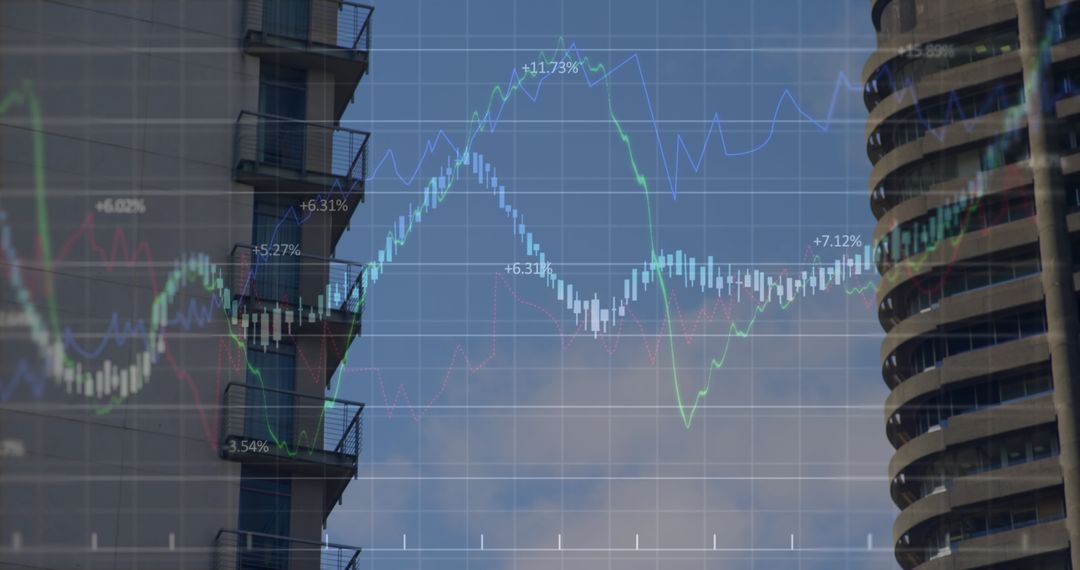
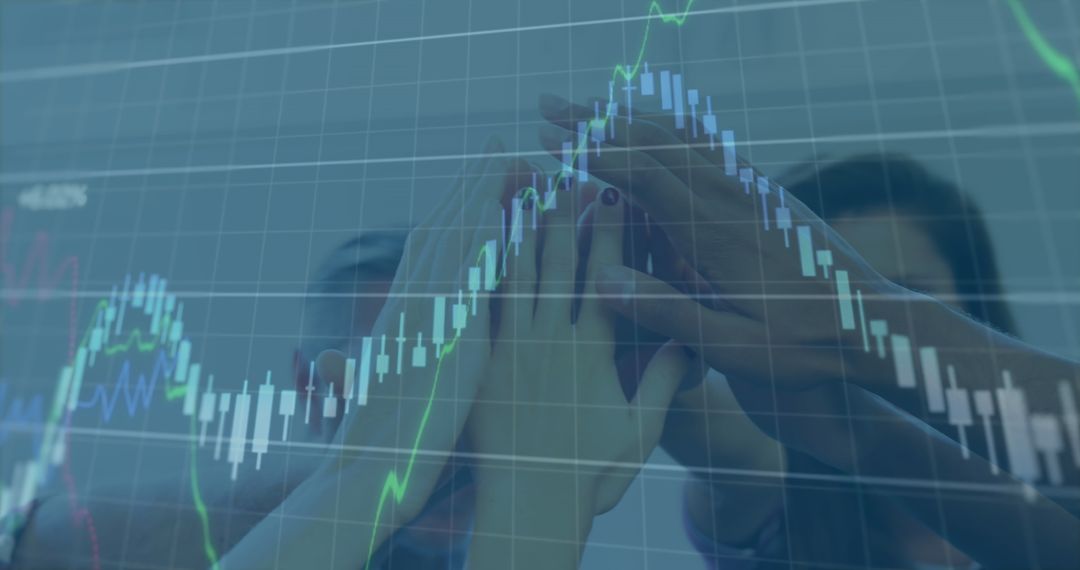
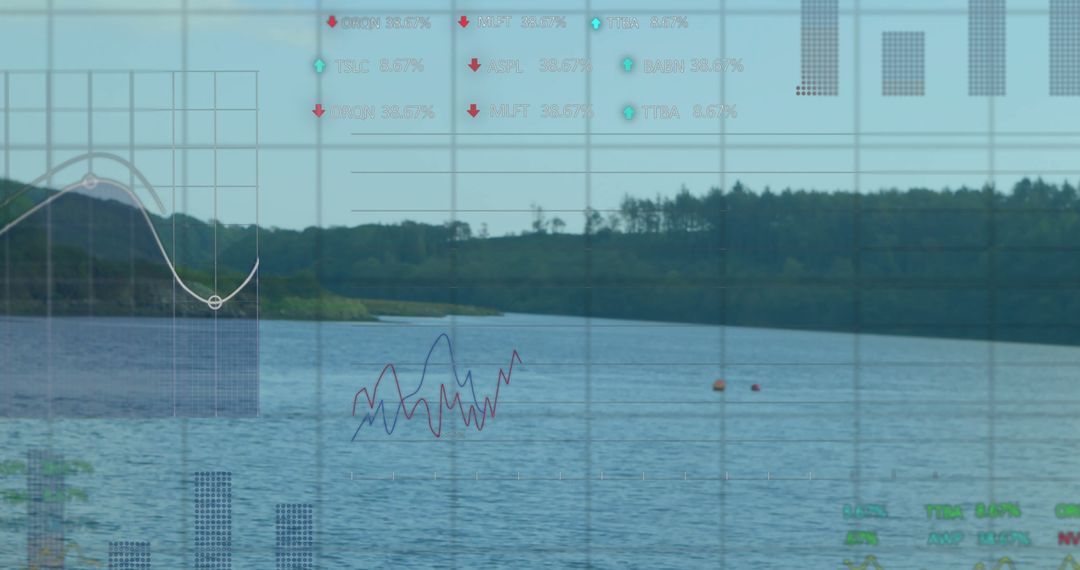
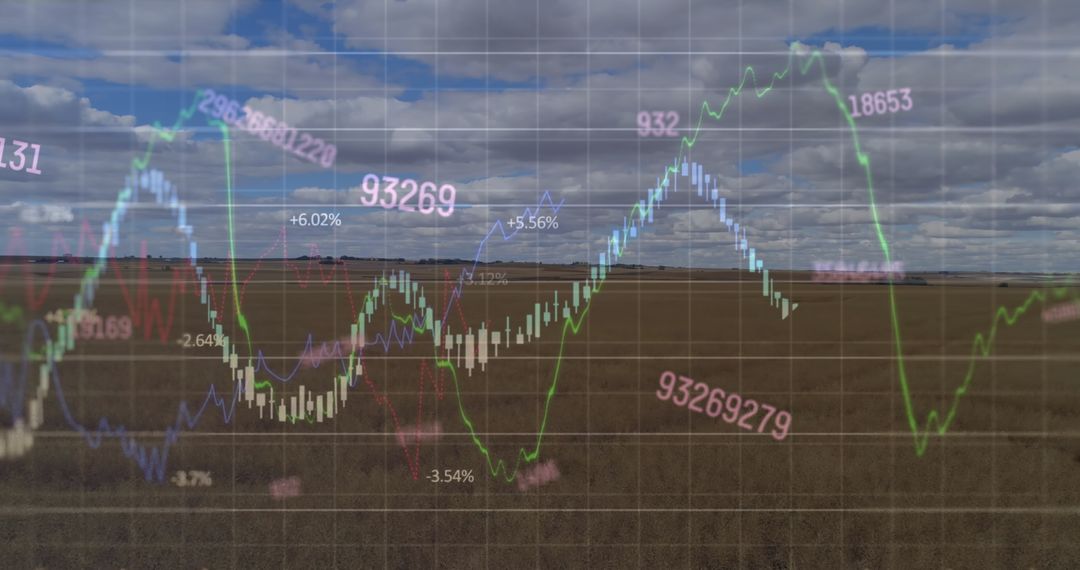
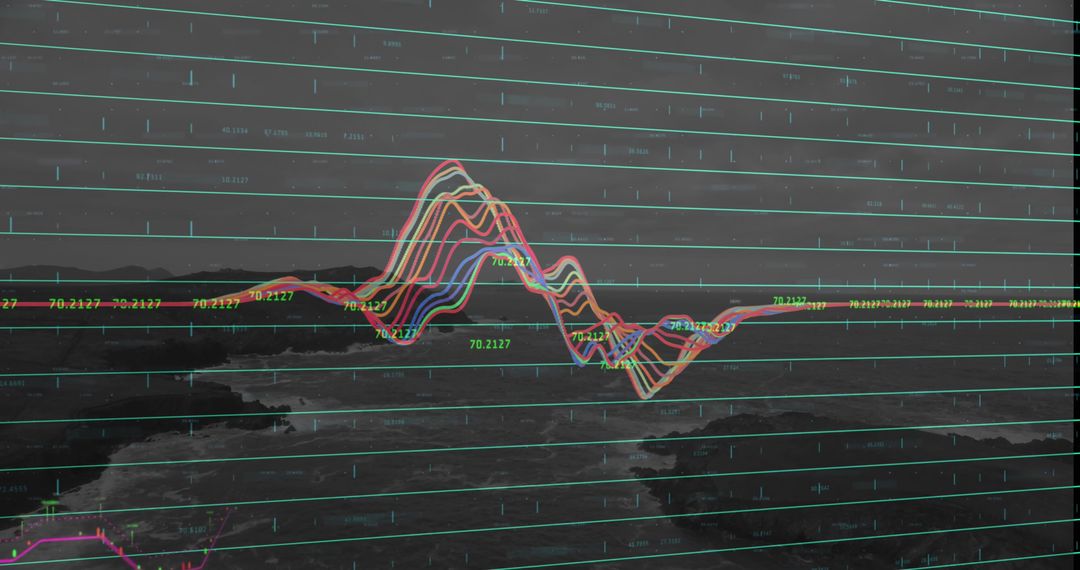
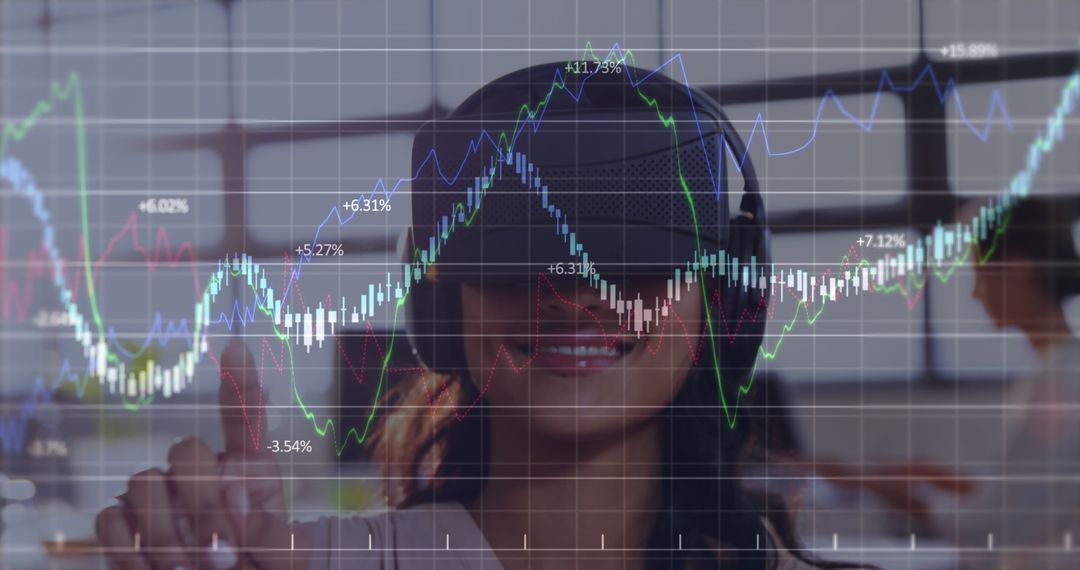
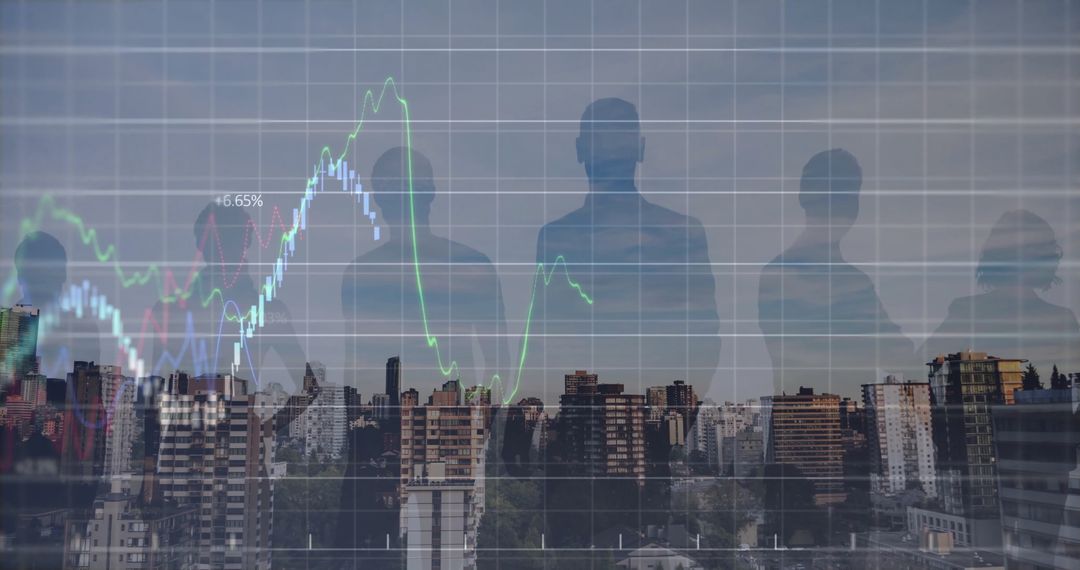
- Technology and Relaxation Blend at Seaside Destination
Technology and Relaxation Blend at Seaside Destination Image
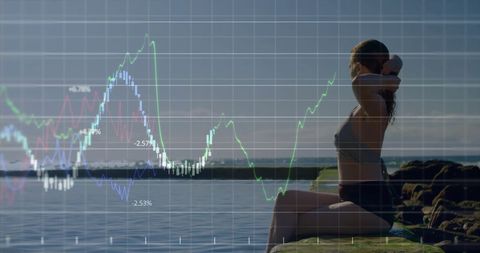
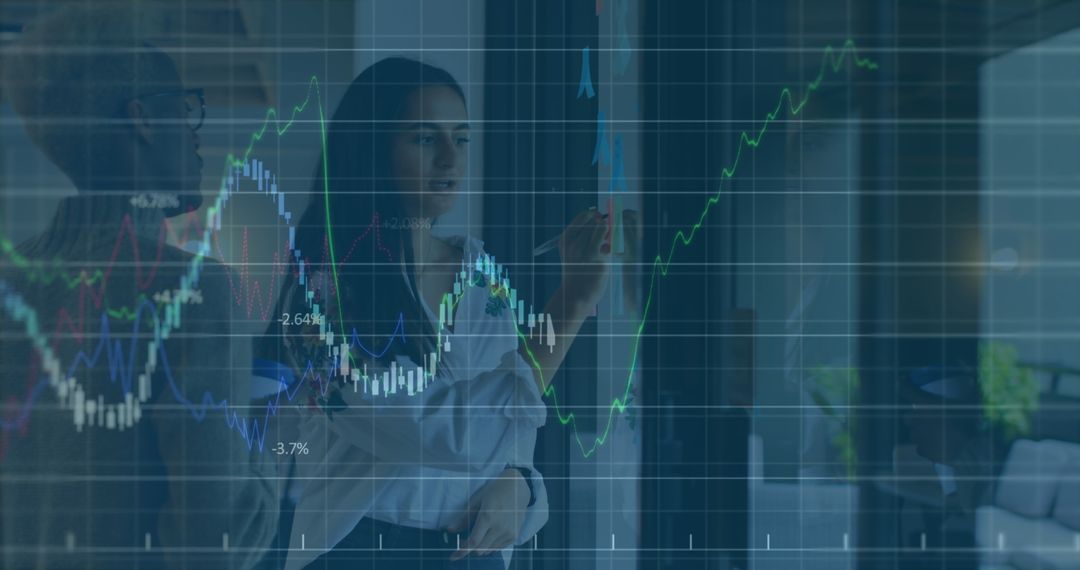
Image shows woman at beach with overlaid digital charts and graphs, symbolizing a mix of relaxation and modern digital connectivity. Useful for businesses or articles focusing on remote work, offsite productivity, work-life balance, or vacations with connectivity requirements.
Powered by  - Get 15% off with code: PIKWIZARD15


6
downloads
downloads
Tags:
More
Credit Photo
If you would like to credit the Photo, here are some ways you can do so
Text Link
photo Link
<span class="text-link">
<span>
<a target="_blank" href=https://pikwizard.com/photo/technology-and-relaxation-blend-at-seaside-destination/1ee2a06df9b1c95b635eadb239bbabbf/>PikWizard</a>
</span>
</span>
<span class="image-link">
<span
style="margin: 0 0 20px 0; display: inline-block; vertical-align: middle; width: 100%;"
>
<a
target="_blank"
href="https://pikwizard.com/photo/technology-and-relaxation-blend-at-seaside-destination/1ee2a06df9b1c95b635eadb239bbabbf/"
style="text-decoration: none; font-size: 10px; margin: 0;"
>
<img src="https://pikwizard.com/pw/medium/1ee2a06df9b1c95b635eadb239bbabbf.jpg" style="margin: 0; width: 100%;" alt="" />
<p style="font-size: 12px; margin: 0;">PikWizard</p>
</a>
</span>
</span>
Free (free of charge)
Free for personal and commercial use.
Author: People Creations
Similar Free Stock Images

Premium


Premium


Premium


Premium


Premium


Premium


Premium


Premium


Premium


Premium


Premium


Premium


Premium


Premium


Premium


Premium


Premium


Premium


Premium


Premium


Premium


Premium


Premium


Premium