
- Home >
- Stock Photos >
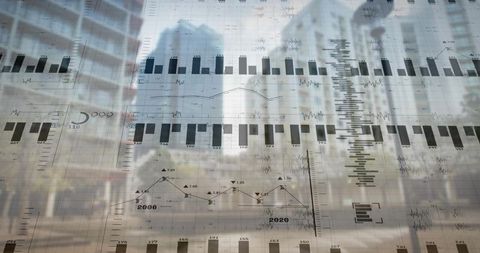
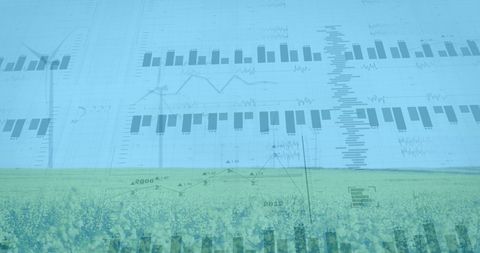
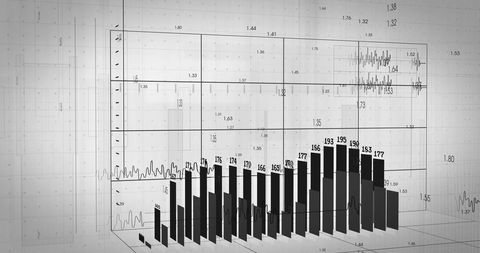
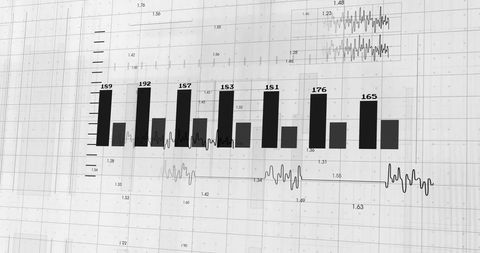
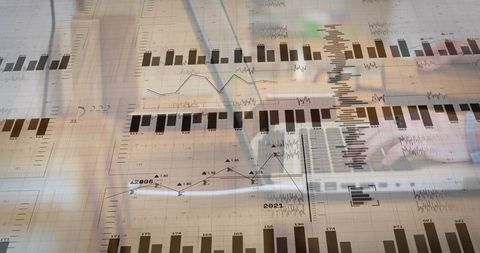
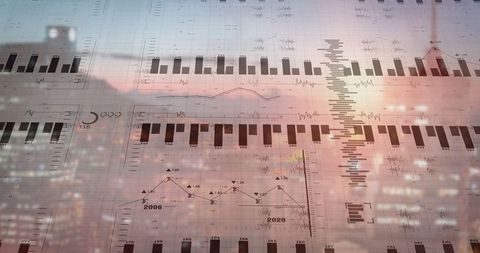
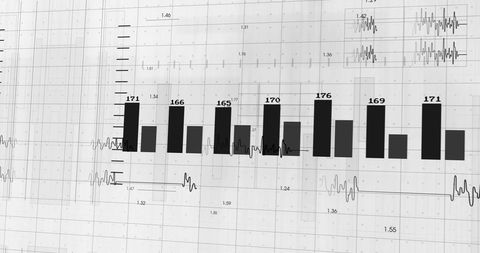
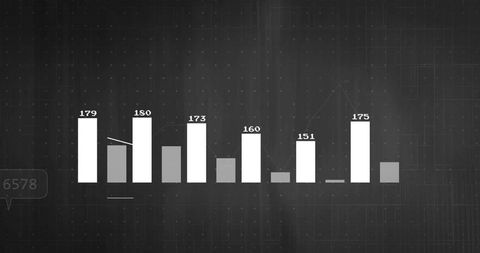
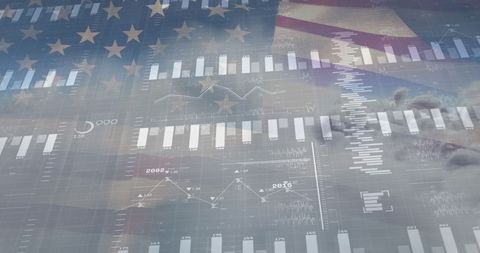
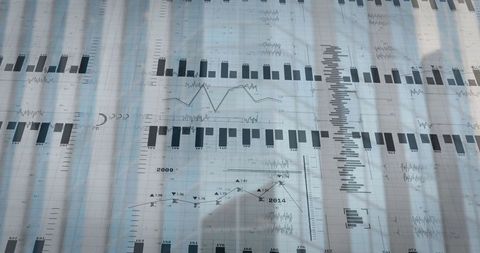
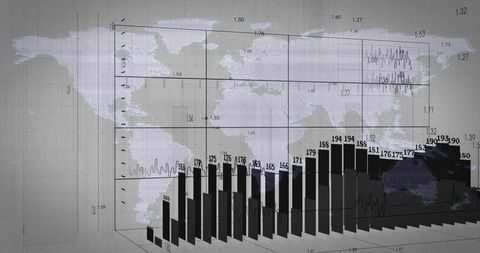
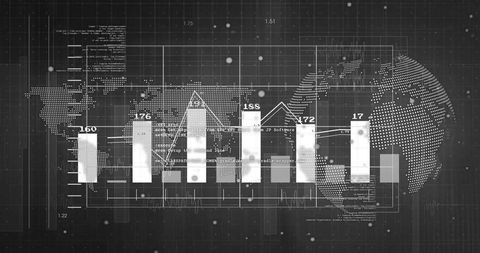
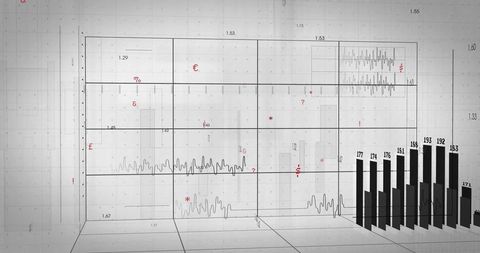
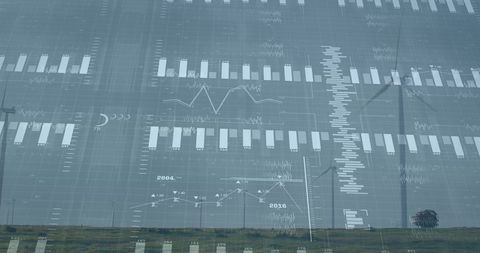
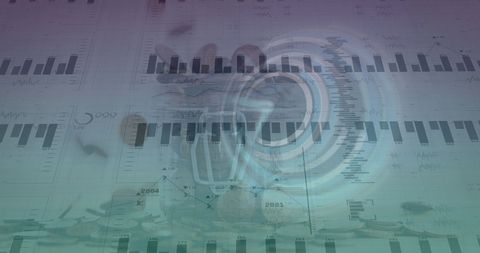
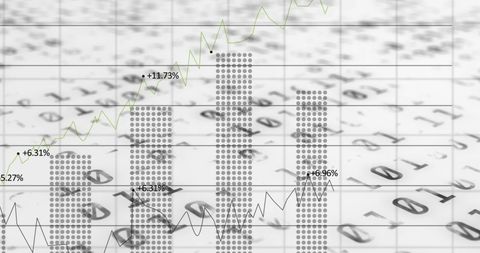
- Technology-Driven Digital Analysis Chart with Globe Overlay
Technology-Driven Digital Analysis Chart with Globe Overlay Image
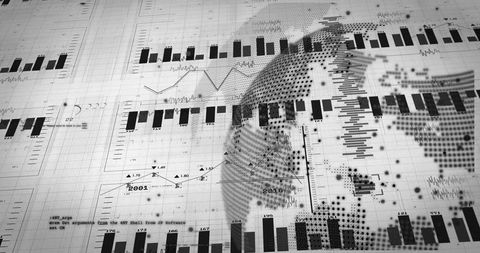
This visual represents a digital analytics display overlayed with a dynamic globe and bar charts. Utilization spans business reports, financial projections, or technology presentations. The futuristic and digitalization themes make this suitable for illustrating software capabilities or presenting complex data simulations.
Powered by 


downloads
Tags:
More
Credit Photo
If you would like to credit the Photo, here are some ways you can do so
Text Link
photo Link
<span class="text-link">
<span>
<a target="_blank" href=https://pikwizard.com/photo/technology-driven-digital-analysis-chart-with-globe-overlay/900cdf6403f3b8f6f5d90a5cea017ec7/>PikWizard</a>
</span>
</span>
<span class="image-link">
<span
style="margin: 0 0 20px 0; display: inline-block; vertical-align: middle; width: 100%;"
>
<a
target="_blank"
href="https://pikwizard.com/photo/technology-driven-digital-analysis-chart-with-globe-overlay/900cdf6403f3b8f6f5d90a5cea017ec7/"
style="text-decoration: none; font-size: 10px; margin: 0;"
>
<img src="https://pikwizard.com/pw/medium/900cdf6403f3b8f6f5d90a5cea017ec7.jpg" style="margin: 0; width: 100%;" alt="" />
<p style="font-size: 12px; margin: 0;">PikWizard</p>
</a>
</span>
</span>
Free (free of charge)
Free for personal and commercial use.
Author: Awesome Content
Similar Free Stock Images

Premium


Premium


Premium


Premium


Premium


Premium

Premium


Premium


Premium

Premium


Premium


Premium

Premium

Premium


Premium


Premium


Premium


Premium


Premium


Premium


Premium


Premium


Premium


Premium


Premium

Explore More Free Stock Images