- Home >
- Stock Photos >
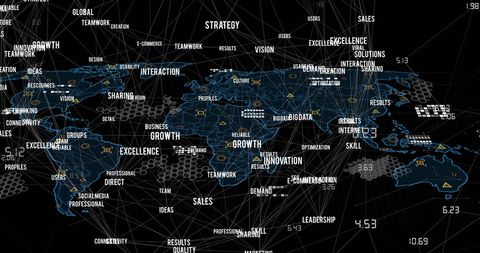
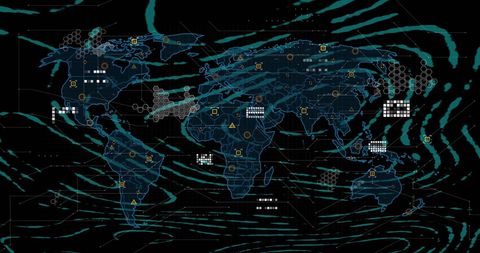
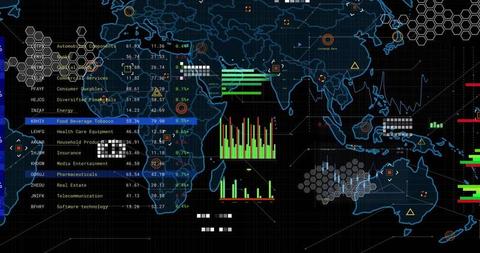
- Technology-Driven World Map with Graphs and Digital Data Analytics
Technology-Driven World Map with Graphs and Digital Data Analytics Image

Illustration displays digitally-generated world map integrated with graphs, finance and economy-related data icons, conveying a sense of global technology and network connectivity. Useful for presentations on technological advancements, global communication, financial analysis, and digital data trends, offering backdrop insight into data-driven business strategy.

downloads
Tags:
More
Credit Photo
If you would like to credit the Photo, here are some ways you can do so
Text Link
photo Link
<span class="text-link">
<span>
<a target="_blank" href=https://pikwizard.com/photo/technology-driven-world-map-with-graphs-and-digital-data-analytics/32a1416ae4f2d6de9a074ea9df2c5f23/>PikWizard</a>
</span>
</span>
<span class="image-link">
<span
style="margin: 0 0 20px 0; display: inline-block; vertical-align: middle; width: 100%;"
>
<a
target="_blank"
href="https://pikwizard.com/photo/technology-driven-world-map-with-graphs-and-digital-data-analytics/32a1416ae4f2d6de9a074ea9df2c5f23/"
style="text-decoration: none; font-size: 10px; margin: 0;"
>
<img src="https://pikwizard.com/pw/medium/32a1416ae4f2d6de9a074ea9df2c5f23.jpg" style="margin: 0; width: 100%;" alt="" />
<p style="font-size: 12px; margin: 0;">PikWizard</p>
</a>
</span>
</span>
Free (free of charge)
Free for personal and commercial use.
Author: Creative Art