
- Home >
- Stock Photos >
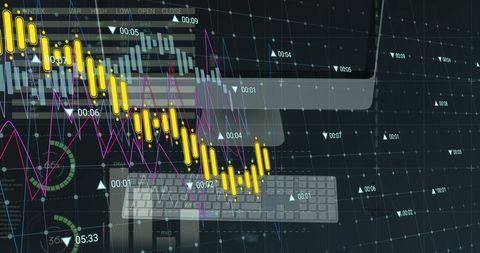
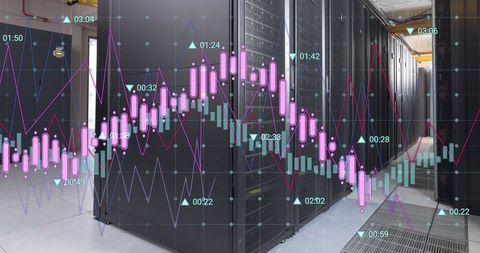
- Technology Interface with Business Data Analysis Charts
Technology Interface with Business Data Analysis Charts Image
Vibrant representation of technology integration in business settings, highlighting digital data analysis and economic trends with overlapping charts and graphs. Useful for illustrating articles or presentations on technological advancements in finance, data analysis, or business intelligence.
Powered by 


downloads
Tags:
More
Credit Photo
If you would like to credit the Photo, here are some ways you can do so
Text Link
photo Link
<span class="text-link">
<span>
<a target="_blank" href=https://pikwizard.com/photo/technology-interface-with-business-data-analysis-charts/16fc2f1e465ad27f96d6c16486d8f5d9/>PikWizard</a>
</span>
</span>
<span class="image-link">
<span
style="margin: 0 0 20px 0; display: inline-block; vertical-align: middle; width: 100%;"
>
<a
target="_blank"
href="https://pikwizard.com/photo/technology-interface-with-business-data-analysis-charts/16fc2f1e465ad27f96d6c16486d8f5d9/"
style="text-decoration: none; font-size: 10px; margin: 0;"
>
<img src="https://pikwizard.com/pw/medium/16fc2f1e465ad27f96d6c16486d8f5d9.jpg" style="margin: 0; width: 100%;" alt="" />
<p style="font-size: 12px; margin: 0;">PikWizard</p>
</a>
</span>
</span>
Free (free of charge)
Free for personal and commercial use.
Author: Awesome Content
Similar Free Stock Images

Premium


Premium

Premium


Premium


Premium

Premium


Premium


Premium


Premium

Premium


Premium


Premium


Premium

Premium


Premium


Premium


Premium


Premium


Premium


Premium


Premium


Premium


Premium


Premium


Premium


Explore More Free Stock Images