- Home >
- Stock Photos >
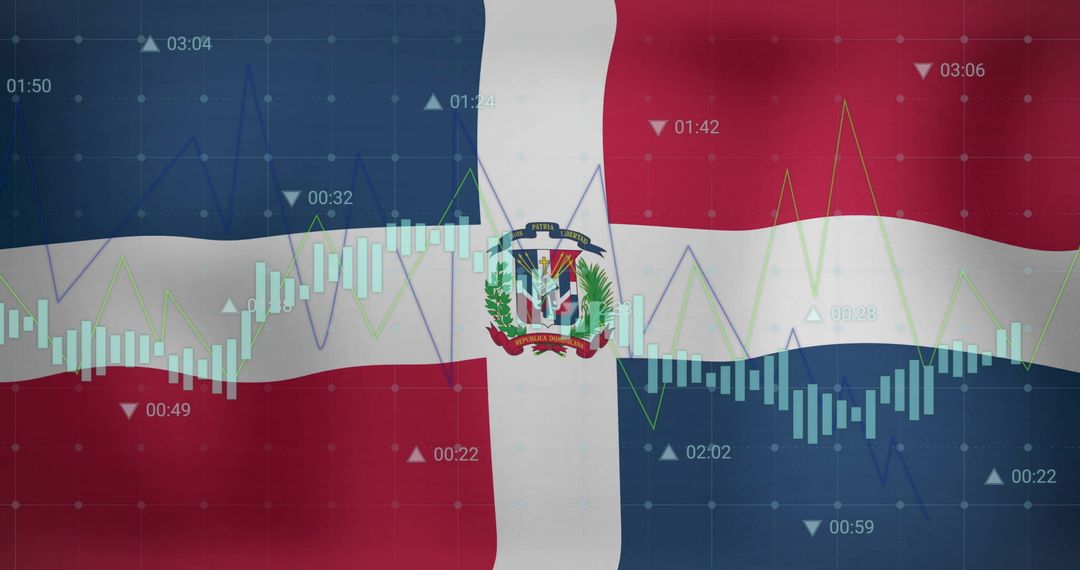
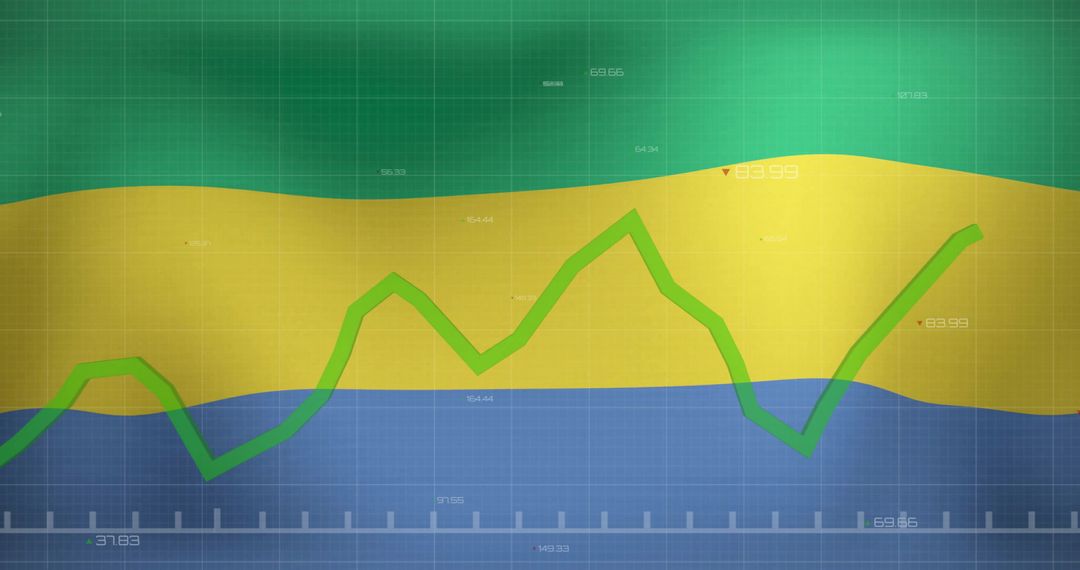
- Thailand Flag and Data Visually Merging with Waste Management Concept
Thailand Flag and Data Visually Merging with Waste Management Concept Image
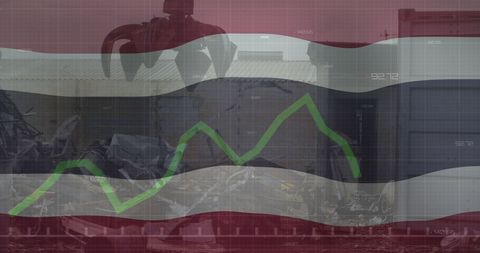
The abstract visualization combines Thailand's flag, a data graph, and a trash dump. This metaphorical blend represents the intersection of national identity, data influence, and environmental concerns. It can be used for articles on Thailand's economic trends, talks on global market impact, environmental statistics, and business presentations on sustainability initiatives in Southeast Asia.
Powered by 


2
downloads
downloads
Tags:
More
Credit Photo
If you would like to credit the Photo, here are some ways you can do so
Text Link
photo Link
<span class="text-link">
<span>
<a target="_blank" href=https://pikwizard.com/photo/thailand-flag-and-data-visually-merging-with-waste-management-concept/d62b2d3dab8830f790372fc9eabd4a03/>PikWizard</a>
</span>
</span>
<span class="image-link">
<span
style="margin: 0 0 20px 0; display: inline-block; vertical-align: middle; width: 100%;"
>
<a
target="_blank"
href="https://pikwizard.com/photo/thailand-flag-and-data-visually-merging-with-waste-management-concept/d62b2d3dab8830f790372fc9eabd4a03/"
style="text-decoration: none; font-size: 10px; margin: 0;"
>
<img src="https://pikwizard.com/pw/medium/d62b2d3dab8830f790372fc9eabd4a03.jpg" style="margin: 0; width: 100%;" alt="" />
<p style="font-size: 12px; margin: 0;">PikWizard</p>
</a>
</span>
</span>
Free (free of charge)
Free for personal and commercial use.
Author: People Creations
Similar Free Stock Images